GIDEON blog

Free Demo ► Latest Updates ► Video Tutorials ►
Subscribe , j x

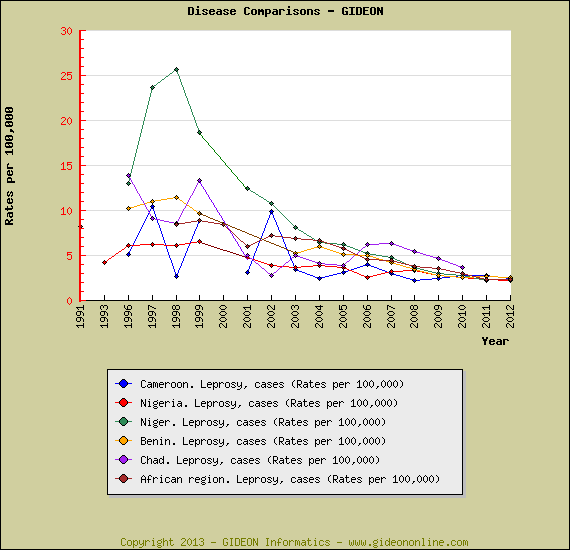
Leprosy in Nigeria

Leprosy rates in Nigeria have been decreasing slowly since the 1990’s, and are similar to those of surrounding countries and Africa as a whole. [1,2] See graph [3]:

Leprosy-Africa

References:
1. Berger SA. Infectious Diseases of Nigeria, 2013. 442 pages, 62 graphs, 2519 references. Gideon e-books, https://www.gideononline.com/ebooks/country/infectious-diseases-of-nigeria/
2. Berger SA. Leprosy: Global status, 2013. 238 pages, 377 graphs, 276 references. Gideon e-books, https://www.gideononline.com/ebooks/disease/leprosy-global-status/
3. Gideon Graph Tool, see tutorial at https://www.gideononline.com/wp-content/uploads/Gideon-Graphs.pps

Note featured on ProMED

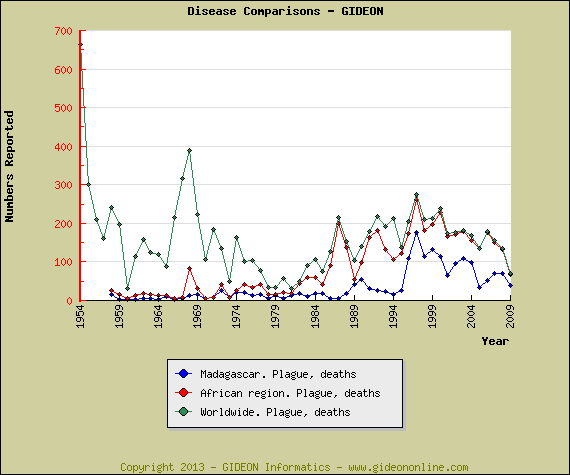
Fatal Plague in Madagascar

Madagascar accounts for most plague deaths in the world – see graph

plague deaths

The Human Cost of Yellow fever in America: A Chronology

The Human Cost of Yellow fever in America: A Chronology [1,2] (primary references available on request).

1793 to 1900 – An estimated 500,000 cases of yellow fever occurred in the United States.
1693 to 1905- An estimated 100,000 to 150,000 died of yellow fever in the United States. These figures included 14,217 deaths in Philadelphia during 1699 to 1803.
1904 to 1914 – The death rate among American personnel involved in constructing the Panama Canal was 15.8 per 1,000.

Chronology:
1668 – Yellow fever was first reported in North America – including 370 fatal cases in New York City
1803 – 606 fatal cases were reported in New York City.
1856 – 538 fatal cases were reported in New York City.
1793 – An outbreak (4,044 fatal cases – 10% of the population) was reported in Philadelphia.
1794 – An outbreak (360 fatal cases) was reported in Baltimore, Maryland.
1798 – Outbreaks were reported in Philadelphia, Pennsylvania (3,506 fatal cases) and New York City.
1800 – An outbreak (1,197 fatal cases) was reported in Baltimore, Maryland.
1803 – Outbreaks (606 fatal cases) were reported in New York City and Philadelphia, Pennsylvania.
1838 to 1839 – An outbreak was reported in Charleston, South Carolina.
1839 – An outbreak (250 fatal cases – 5% of the population) was reported in Galvaston, Texas.
1852 – An outbreak was reported in Charleston, South Carolina.
1853 – An outbreak (4,858 fatal cases) was reported in New Orleans.
1855 – An outbreak was reported in Virginia.
1862 – An outbreak was reported in Wilmington, North Carolina.
1867 – An outbreak (1,150 fatal cases – 5% of the population) was reported in Galveston, Texas.
1877 – An outbreak was reported in Port Royal, South Carolina.
1878 – An outbreak (13,000 fatal cases) was reported in the Mississippi Valley. 4,046 fatal cases were reported in New Orleans, Louisiana.
1888 – An outbreak was reported in Mississippi.
1905 – America’s last outbreaks were reported in New Orleans, Louisiana (8,399 cases) and Pensacola, Florida.
1910 – A case of yellow fever was identified in a ship arriving to Hawaii, with secondary infection of a quarantine guard.
1911 – The last indigenous case of yellow fever in the United States was reported.
1924 – An imported case was reported.
1996 – A traveler from Brazil died of yellow fever in Tennessee.
1999 – A fatal case (non-vaccinated American tourist returning from Venezuela) was reported in California.
2002 – An American traveler died of yellow fever in Texas following return from Brazil.

Some famous American Yellow fever victims: [3]
1704 – French explorers Pierre-Charles Le Seuer (first European to explore the Minnesota River valley) and Henri de Tonti (explorer with La sale) died of yellow fever in Alabama.
1790 – Samuel Nicholas, first Commandant of the United States Marines, died of yellow fever in Philadelphia.
1798 – John Fenno, prominent journalist, dies of yellow fever in Philadelphia.
1820- Benjamin Latrobe, designer of the United States Capitol, died of yellow fever in New Orleans, Louisiana.
1844 – John Conrad Otto, noted physician, died of yellow fever in Philadelphia.
1867 – Michael O’Laughlen, a conspirator in the Lincoln assassination, died of Yellow fever in the Florida keys.
1835 – Dr. David Hosack, the doctor who attended Alexander Hamilton, died of shock (possibly yellow fever) in New York City.
1862 – Ormsby Mitchel, astronomer and Civil War general, died of yellow fever in South Carolina.
1863 – Designer of the first Trans-continental Railway (fatal infection, contracted in Panama)
1879 – General John Bell Hood dies of yellow fever in New Orleans, Louisiana.
1888- Richard A. Proctor, a pioneer in Martian astronomy, died of yellow fever in New York.
1900 to 1901 – Dr. Jesse William Lazear and nurse Clara Maass died of yellow fever after allowing themselves to be bitten by infected mosquitoes in Panama.
1902 – Thomas Nast, political cartoonist, died of yellow fever in Ecuador.
1929 – Dr. Paul A. Lewis, a noted yellow fever researcher, died of the disease in Brazil.

Americans who survived yellow fever have included:
Benjamin Rush (physician and signatory to the Declaration of Independence)
Anson Jones (President of The Republic of Texas)
Jack London (author)
Cyrus McCormick (inventor of the mechanical reaper)
Donald Meek (movie actor)
Philip Syng Physick (“the father of American surgery”).
Zachary Taylor (American President), contracted Yellow fever while serving the in Army in New Orleans, Louisiana (ca. 1809)

References:
1. Berger SA. Infectious Diseases of the United States, 2013. 1,119 pages, 470 graphs, 11,030 references. Gideon e-books, www.gideononline.com/ebooks/country/infectious-diseases-of-the-united-states/
2. Berger SA. Yellow Fever: Global Status, 2013. 142 pages, 124 graphs, 678 references. Gideon e-books, www.gideononline.com/ebooks/disease/yellow-fever-global-status/
3. Berger SA. www.VIPatients.com

Note featured on ProMED

Parvovirus B19 in the United Kingdom

The following background data on Parvovirus B19 infection in the United Kingdom is abstracted from Gideon www.GideonOnline.com and the Gideon e-book series. [1,2]

Parvovirus B19 (Erythrovirus B19) was first discovered in England in 1974, among serum specimens from healthy blood donors.
– Highest rates are reported during spring and early summer.
– Epidemics are reported every 4 to 5 years – the last occurring during 1997 to 1998.
– Infection is estimated to occur in 1:512 pregnancies, and may account for as many as 150 fetal deaths annually (26% of viruses associated with fetal death)..

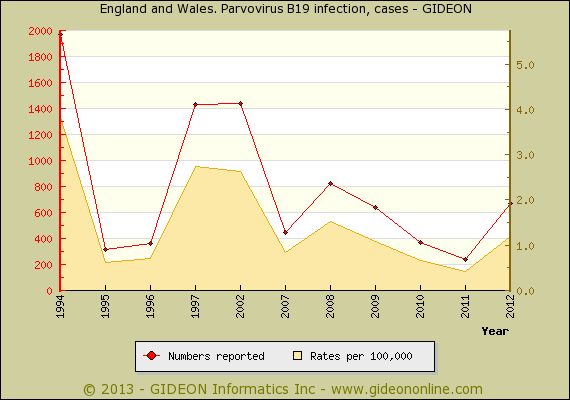
The following graph illustrates annual incidence and disease rates per 100,000 population:

EWParvoB19

Seroprevalence surveys:
45% by age 10 years and 70% by age 60 (England)
21% by age 4 years and >75% over 40 years (England 1996)
62% of women in child-bearing age – 0.69% acquired parvovirus during their pregnancy (2007 publication)
66.5% of women of child-bearing age (Northern Ireland, 2012 publication)
81% of patients with rheumatoid arthritis and 77% of patients with osteoarthritis (Northern Ireland, 1995 publication)
21% of HIV-positive patients and 0% of HIV-negative controls (Northern Ireland, 1997 publication)

Notable outbreaks:
1983 – An outbreak (36 cases) of erythema infectiosum was reported at a school in north London.
1985 (publication year) – An outbreak of erythema infectiosum was reported in Bristol.
1985 – An outbreak of concurrent influenza and Parvovirus B19 infections was reported in a boys’ boarding school.
1987 – An outbreak (97 cases) of erythema infectiosum was reported at a primary school in Bury, Lancashire.
1989 (publication year) – An outbreak (54 cases) of erythema infectiosum was centered at a junior school.
1992 (publication year) – An outbreak (12 cases) of erythema infectiosum was reported among staff and patients on a children’s ward.
1992 – An outbreak (18 cases) of erythema infectiosum was reported among adult patients on a hospital ward in London.
1996 (publication year) – An outbreak of erythema infectiosum was reported at a primary school.

References:
!. Berger SA. Parvovirus B19: Global Status, 2013. 27 pages, 9 graphs, 289 references. Gideon e-books, https://www.gideononline.com/ebooks/disease/parvovirus-b19-global-status/
2. Berger SA. Infectious Diseases of the United Kingdom, 2013. 1106 pages, 946 graphs, 3801 references. Gideon e-books, https://www.gideononline.com/ebooks/country/infectious-diseases-of-the-united-kingdom/

Toxoplasmosis in Brazil

Brazil’s obsession with toxoplasmosis is difficult to explain. The term, “Toxoplasma” appears in 0.363% of all Brazilian publications indexed on PubMed http://www.ncbi.nlm.nih.gov/pubmed – as compared to 0.086% of publications from the United States. Abstracts from Gideon www.GideonOnline.com summarize 120 relevant surveys / serosurveys from Brazil, but only 19 from the combined literature of neighboring Bolivia, Argentina and Venezuela (only 38 from the United States). Strikingly, there have been only 37 Brazilian surveys of HIV infection, and only 9 of dengue as of 2013.

The following list of Brazilian Toxoplasma surveys is abstracted from the Gideon e-book series [1,2]. (Primary references available on request)

Prevalence surveys:
0.4% of solid organ transplant recipients (2001 to 2006)
3.8% of the general population and 5.8% of seropositive individuals in Barra Mansa, Rio de Janeiro State (ocular toxoplasmosis, 2009 publication)
19.8% of eye diseases treated at an ophthalmology clinic in Sao Paulo (2013 publication)
4.8% of HIV-positive patients in the southern region (history of neurotoxoplasmosis, 2009 to 2010)
10% of autopsied AIDS patients (cause of death, Amazonas, 1996 to 2003)
7.84% of slaughtered goats in Bahia (2009 publication)
11.6% of horses at slaughter (2013 publication)
34% and 66% of porcine diaphragm and tongue, respectively, in Southern Brazil. (2007 publication)
22.58% of soil samples from school playgrounds in northwestern Sao Paulo (2010 publication)

Seroprevalence surveys:
71% of persons ages 16 to 20 in Rio de Janeiro City (1987)
84% of low income groups in Rio de Janeiro (1997 to 1999)
73.3% of persons in farming areas of rural Rondonia state (2006 publication)
79.45% of persons in farming areas of rural Mato Grosso do Sul (2008 publication)
52.6% of persons in rural Sao Paulo (2013 publication)
73.5% of Indians in Lauarete, Sao Gabriel da Cachoeira, Amazonas (2008 publication)
97.4% on farms in southwestern Mato Grosso State (2009 publication)
65.8% of rural settlers ages 5 to 90 years, in Amazonia (2004)
65.9% of persons in Barra Mansa, Rio de Janeiro State (2009 publication)
64.9% of women at childbearing age in Metropolitan Sao Paulo (2009 publication)
33.8% of female nursing students in Presidente Prudente, Sao Paulo (2010 publication)
56.4% of pregnant women in Bahia (2011 publication)
54.2% of pregnant women in Cascaval, Parana (2008 publication)
69.7% of pregnant women in Fortaleza, Ceara State (2003)
68.8% of pregnant women in Fortaleza (2010 publication)
67.7% of pregnant women in Goias (2008)
66.3% of pregnant women in Natal (2007)
67% of pregnant women in Parana (IgG, 1996 to 1998)
59.0% of pregnant women in Parana (IgG, 2010)
51.7% of pregnant women in Parana (IgG, 2007 to 2010)
55.3% of pregnant women in Parana (IgG and/or IgM, 2007 to 2008)
60.6% of pregnant women in western Parana (2012 publication)
59.8% of pregnant women in Porto Alegre (2000)
74.7% of pregnant women in Recife. 2.8% had possible active infection (2004 to 2005)
74.5% of pregnant women in Rio Grande do Sul (1997 to 1998)
58.5% of pregnant and postpartum women in Niteroi, Rio de Janeiro (2013 publication)
62.1% of pregnant women in Sao Paulo (2011 publication)
64.4% of pregnant women in Sao Jose do Rio Preto, Sao Paulo (2011 publication)
69.3% of pregnant women in Sergipe (2009 publication)
53.03% of pregnant women in southern Brazil (2003 to 2004)
67% of HIV-negative and 72% of HIV-positive pregnant women in Rio Grande do Sul (2002 to 2005)
80% of HIV-positive patient in the southern region (2009 to 2010)
55.6% of children age <1 year in Maringa municipality, Parana (2003 to 2004) 56% of infants with suspected congenital infection in Goiania (2004 to 2005) 42.2% of school children in Rolandia, Parana (1998) 8% of children ages 6 to 13 years in Maringa, Parana (2010 to 2011) 46.4% of elementary school children in Jataizinho, Parana (2008 publication) 74.5% of patients treated at an ophthalmology clinic in Sao Paulo (2013 publication) 79.0% of male and 63.4% of female blood donors in Recife (2001) 33.3% of liver transplant recipients (1997 to 2007) 78.8% of Enawene-Nawe Indians, 59.6% of Waiapi and 55.6% of Tiriyo (2005 publication) 70.0% of slaughterhouse workers in northern Para (2006 publication) 92% of meat inspectors working in slaughter houses (Belo Horizonte, 1975 publication) Seroprevalence surveys in animals: 26.7% of stray cats and 40.6% of breeder cats in Sao Paulo; 84.4% of domestic cats in Parana State. 87.3% of cats and 37.5% of pigs in rural western Amazon (2006 publication) 15.7% of cats in Andradina Municipality, Sao Paulo State (2011 publication) 25.75% of cats with Leishmania chagasi infection were found to be coinfected by Toxoplasma gondii (Sao Paulo State, 2012 publication) 16.3% of cats in Curituba, Parana State (2011 publication) 50.5% of cats with outdoor access, in Sao Luis, Maranhao (2012 publication) 23.80% of dogs with neurological signs, in Curituba, Parana (2011 publication) 14.33% of domiciled cats in Lages, southern Brazil (2010 publication) 84.4% of domestic cats in Santa Isabel do Ivai, Parana State (2004 publication) 22.3% of domestic dogs in Lages and Balneario Camboriu, Santa Catarina State (2009 publication) 69.8% of dogs in Para State (2010 publication) 60.7% of dogs in Lavras, Minas Gerais (2009 publication) 52% of dogs in the southern Amazon region (2012 publication) 18.0% of dogs in Piaui (2011 publication) 22% of dogs with neurological signs, in Botucatu (2012 publication) 20.4% of opossums (Didelphis marsupialis) 24.5% of goats slaughtered in the public slaughterhouse of Patos city, Paraiba State, Northeast region (2007 publication) 14.5% of dairy goats in Sao Paulo 30.6% of goats in Serido Oriental microregion, Rio Grande do Norte state (2008 publication) 32.2% of goats (2008 publication) 43.0% of goats in Minas Gerais (ELISA, 2008 publication) 8.54% of swine and 7.0% of ovines slaughtered in Guarapuava (2007 publication) 4.5% of wild boar in Sao Paulo (2009 publication) 51.5% of sheep and 20.8% of dogs in Parana (2007 publication) 24.2% of sheep in Sao Paulo State (2008 publication) 32.9% of farm sheep in Alagoas (2009 publication) 25.75% of sheep in Curitiba, Parana State (2009 publication) 29.1% of sheep in Northeast Brazil. (Rio Grande do Norte State, 2007 publication) 38.22% of sheep in Federal District (2008 publication) 20.7% of sheep in Mossoro, Rio Grande do Norte (2008 publication) 52% of sheep in the Jaboticabal microregion, Sao Paulo State (2009 publication) 75% of sheep in Uberlandia, Minas Gerais (ELISA, 2010 publication) 10.96% of sheep in slaughterhouses (2010 publication) 22.1% of sheep in Rio Grande do Norte (2013 publication) 18.6% of sheep from the eastern region of Sao Paulo State (2011 publication) 100% of sheep farms in Santa Catarina (2012 publication) 4.35% of goats and 18.75% of sheep in western Maranhao (2011 publication) 39% of goats in Alagoas State (2011 publication) 18.1% of goats in Paraiba State (2012 publication) 39.41% of goats in Curitiba, Parana (ELISA, 2012 publication) 71.0% of cattle and 88.5% of dogs on farms in southwestern Mato Grosso State (2009 publication) 19.3% of slaughtered cattle in Ilheus, 9.8% in Itabuna and 6.8% in Jequie (Bahia State, 2009 publication) 26% of slaughtered cattle in Bahia State (2009 publication) 49.4% of cattle and 11.5% of pigs in Campos dos Goytacazes, northern of Rio de Janeiro State (2011 publication) 1.96% of cattle and 7.64% of pigs in Rio de Janeiro State (2011 publication) 48.3% of pregnant dairy cows (Bos. taurus) and 3.7% of cow fetuses in southern Brazil (2012 publication) 23.8% of mules and 43.2% of donkeys in Pernambuco, Rio Grande do Norte, Paraiba, and Sergipe (2012 publication) 17% of carthorses in metropolitan Curitiba, Parana State (2013 publication) 11.6% of horses at slaughter (2013 publication) 12.8% of swine matrices in Nova Mutum and Diamantino, Mato Grosso State (2010 publication) 9.6% of pigs (2000 publication) 13.4% of pig breeding farms in the Toledo microregion of Parana (2010 publication) 18.27% of swine raised for slaughter (Bahia, 2009 publication) 36.2% of swine slaughtered in Patos, Paraiba State (2010 publication) 12.5% of slaughtered pigs in Pernambuco (2012 publication) 80% of chickens (Gallus domesticus), 3.0% of (Bos taurus), 60.8% of sheep (Ovis aries), 81.8% of goats (Capra hircus), 43.7% of horses (Equus caballus), 59.3% of cats (Felis catus), 39.6% of dogs (Canis familiaris), 38.2% of black rats (Rattus rattus), and 79.7% of cattle egrets (Bubulcus ibis) (Fernando de Noronha archipelago, 2007 to 2010) 30.2% of Cebus spp. (capuchin monkeys) and 17.6% of A. caraya (black and golden howler monkeys) in Parana State (2005 publication) 46% of jaguarundi (Puma yagouaroundi); 58% of ocelot (Leopardus pardalis); 50% of oncilla (L. tigrinus); 54% of margay (L. wiedii); 12% of Pampas-cat (L. colocolo); 83% of Geofroy's-cat (L. geoffroyi); 64% of jaguar (Panthera onca) and 48% of puma (Puma concolor) (1995 to 2001) 53.3% of free range chickens in Pernambuco, Rio Grande do Norte, Maranhao, Bahia, Ceara, Sergipe, and Alagoas (2008 publication) 40.4% of free-range chickens in Espirito Santo State (2012 publication) 1.02% of sparrows (Passer domesticus) in Bahia and Pernambuco (2009 publication) 5% of urban pigeons (Columba livia, 2010 publication) 1% of feral pigeons (Columba livia) in Jaboticabal (2011 publication) 0% of free-living pigeons in Sao Paulo, Ibiuna and Sorocaba, Sao Paulo State (2010 publication) 75% of capybaras (Hydrochaeris hydrochaeris) in Sao Paulo State (IFTA, 2008 publication) 42.3% (MAT) to 69.8% (IFAT) of capybaras 61.5% of capybaras (2010 publication) 19% of Brazilian agouti (Dasyprocta aguti, 2011 publication) 10% of free-ranging Brazilian tapirs (Tapirus terrestris) in Goias state (one animal seropositive, 2010 publication) 12.9% of nine-banded armadillos (Dasypus novemcinctus) (Sao Paulo, 2008 publication) 19.2% of crab-eating foxes (Cerdocyon thous) in zoos (2009 publication) 63.4% of wild felids maintained in Brazilian zoos (2010 publication) 75% of wild-maned wolves (Chrysocyon brachyurus) in Minas Gerais (2003 to 2008) 66.67% of neotropical felids (Leopardus geoffroyi, Puma yagouaroundi, Leopardus wiedii, Leopardus tigrinus and Leopardus pardalis, 2010 publication) 0% of vampire bats (Desmodus rotundus) in Botucatu region, Sao Paulo (2009 publication) 34.8% of mammals from zoos and breeding facilities in the north and northeast regions (2010 publication) 0.9% of urban rodents in Sao Paulo (2011 publication) 5.5% of opossums (Didelphis albiventris) in Botucatu Municipality, Sao Paulo (2008 to 2009) 1.35% of rabbit meat juices (2011 publication) 86.3% of Amazon River dolphins (Inia geoffrensis) from a reserve in Tefe, Amazonas (2011 publication) 39.2% of captive manatees (Trichechus inunguis) in northern Brazil (2012 publication) References: 1. Berger SA. Infectious Diseases of Brazil, 2013. 580 pages, 118 graphs, 4917 references. Gideon e-books, https://www.gideononline.com/ebooks/disease/toxoplasmosis-global-status/

Note featured on ProMED
Importation of Rabid Animals

The following chronology of rabies in imported animals is extracted from Gideon www.GideonOnline.com and the Gideon e-book series [1] (primary references available on request)
Note that most common scenario has involved rabid dogs imported from Morocco.

Year / Imported From / Into (comments) *

1969 to 1970 / Germany and Pakistan / United Kingdom
1972 / Afghanistan / Netherlands
1987 / Mexico / United States (one dog and one cat)
1992 / Algeria / France (subsequently implicated in a case of human rabies)
1997 / Morocco / Switzerland
2001 / Morocco / France
2001 / Nepal / Germany
2002 / Morocco / France
2002 / Azerbaijan / Germany
2003 / North Africa / Switzerland
2003 / Estonia / Finland (horse)
2004 / Morocco / France (2 dogs)
2004 / Morocco / Germany
2004 / Thailand / United States
2004 / Puerto Rico / United States
2007 / Morocco / Belgium
2007 / India / United States
2007 / India / Finland
2007 / Morocco / France (2 secondary cases reported among dogs in France)
2008 / Sri Lanka / England
2008 / Gambia / Belgium (the dog was then transported to France by automobile)
2008 / Croatia / Germany
2008 / Iraq / United States
2009 / Afghanistan / France
2010 / Bosnia-Herzegovina / Germany
2011 / Morocco / France
2012 / Morocco / Spain (the dog was then transported to the Netherlands)
2013 / Morocco / Spain

* Dogs unless otherwise specified

References:
1. Berger SA. Rabies: Global Status, 2013. 382 pages, 548 graphs, 1607 references. Gideon e-books, https://www.gideononline.com/ebooks/disease/rabies-global-status/

Note featured on ProMED
Gonorrhea in Sweden

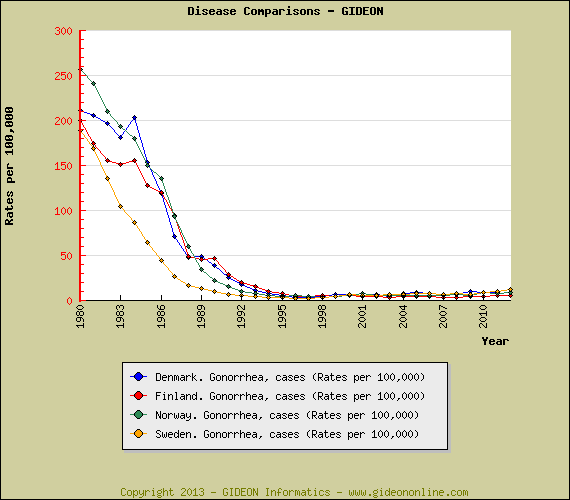
Notwithstanding a slight resurgence during the past 5 years, rates of gonorrhea in Sweden and other Scandinavian countries have decreased dramatically since 1980 and continue to be strikingly similar [1,2] – See graph [3] :

GC-Scandinavia

References:
1. Berger SA. Infectious Diseases of Sweden, 2013. 458 pages, 135 graphs, 2059 references. Gideon e-books, https://www.gideononline.com/ebooks/country/infectious-diseases-of-sweden/
2. Berger SA. Gonococcal infection: Global Status, 2013. 180 pages, 243 graphs, 1075 references. Gideon e-books, https://www.gideononline.com/ebooks/disease/gonococcal-infection-global-status/
3. Gideon Graph Tool, see tutorial at https://www.gideononline.com/wp-content/uploads/Gideon-Graphs.pps

Note featured on ProMED

User Interface Refresh

Over the years GIDEON has added new features and now we’re making changes to improve access and simplify the interface.

We are rolling out a refresh of the GIDEON web app user interface that focuses on simplification.

These changes include:

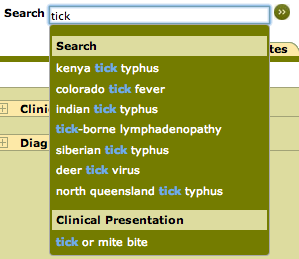
GIDEON search for tick
Improved search

  • Type down: Search terms appear as you type.
  • Suggestions: Subjects related to the items you’re typing appear to easily reach the content you want.
  • Unified search and diagnosis: Specify if you’re looking for a diagnosis by choosing a sign or symptom from the Clinical Presentation list.


Enhanced User Interface

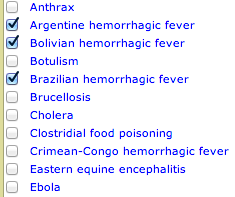
  • Select diseasesScreen size utilization: Content is centered and resized to take advantage of larger screen real estate.
  • Easier to select Diseases, Drugs or  Vaccines to compare.
  • Switched maps from Flash to HTML 5: HTML 5 browsers are more ubiquitous than flash plugin, and maps will now work on iPhones and iPads.
  • Improving interaction on mobile devices: lists have been optimized to work better on mobile devices. These are steps we’re taking to make GIDEON work easily wherever you are.
  • Reduced popups: screen popups have been replaced with CSS popups which allow a one window experience on tablets.



Removed rarely used functions

  • Infectious Diseases and Microbiology focus: Toxicology module removed since beta demonstrated little usage of the content.
  • Travel streamlined: Travel in Infectious Diseases is focused on GIDEON content removing content available directly on CDC website.


We would love to receive feedback on these changes.


Typhoid Fever Outbreaks in the United States

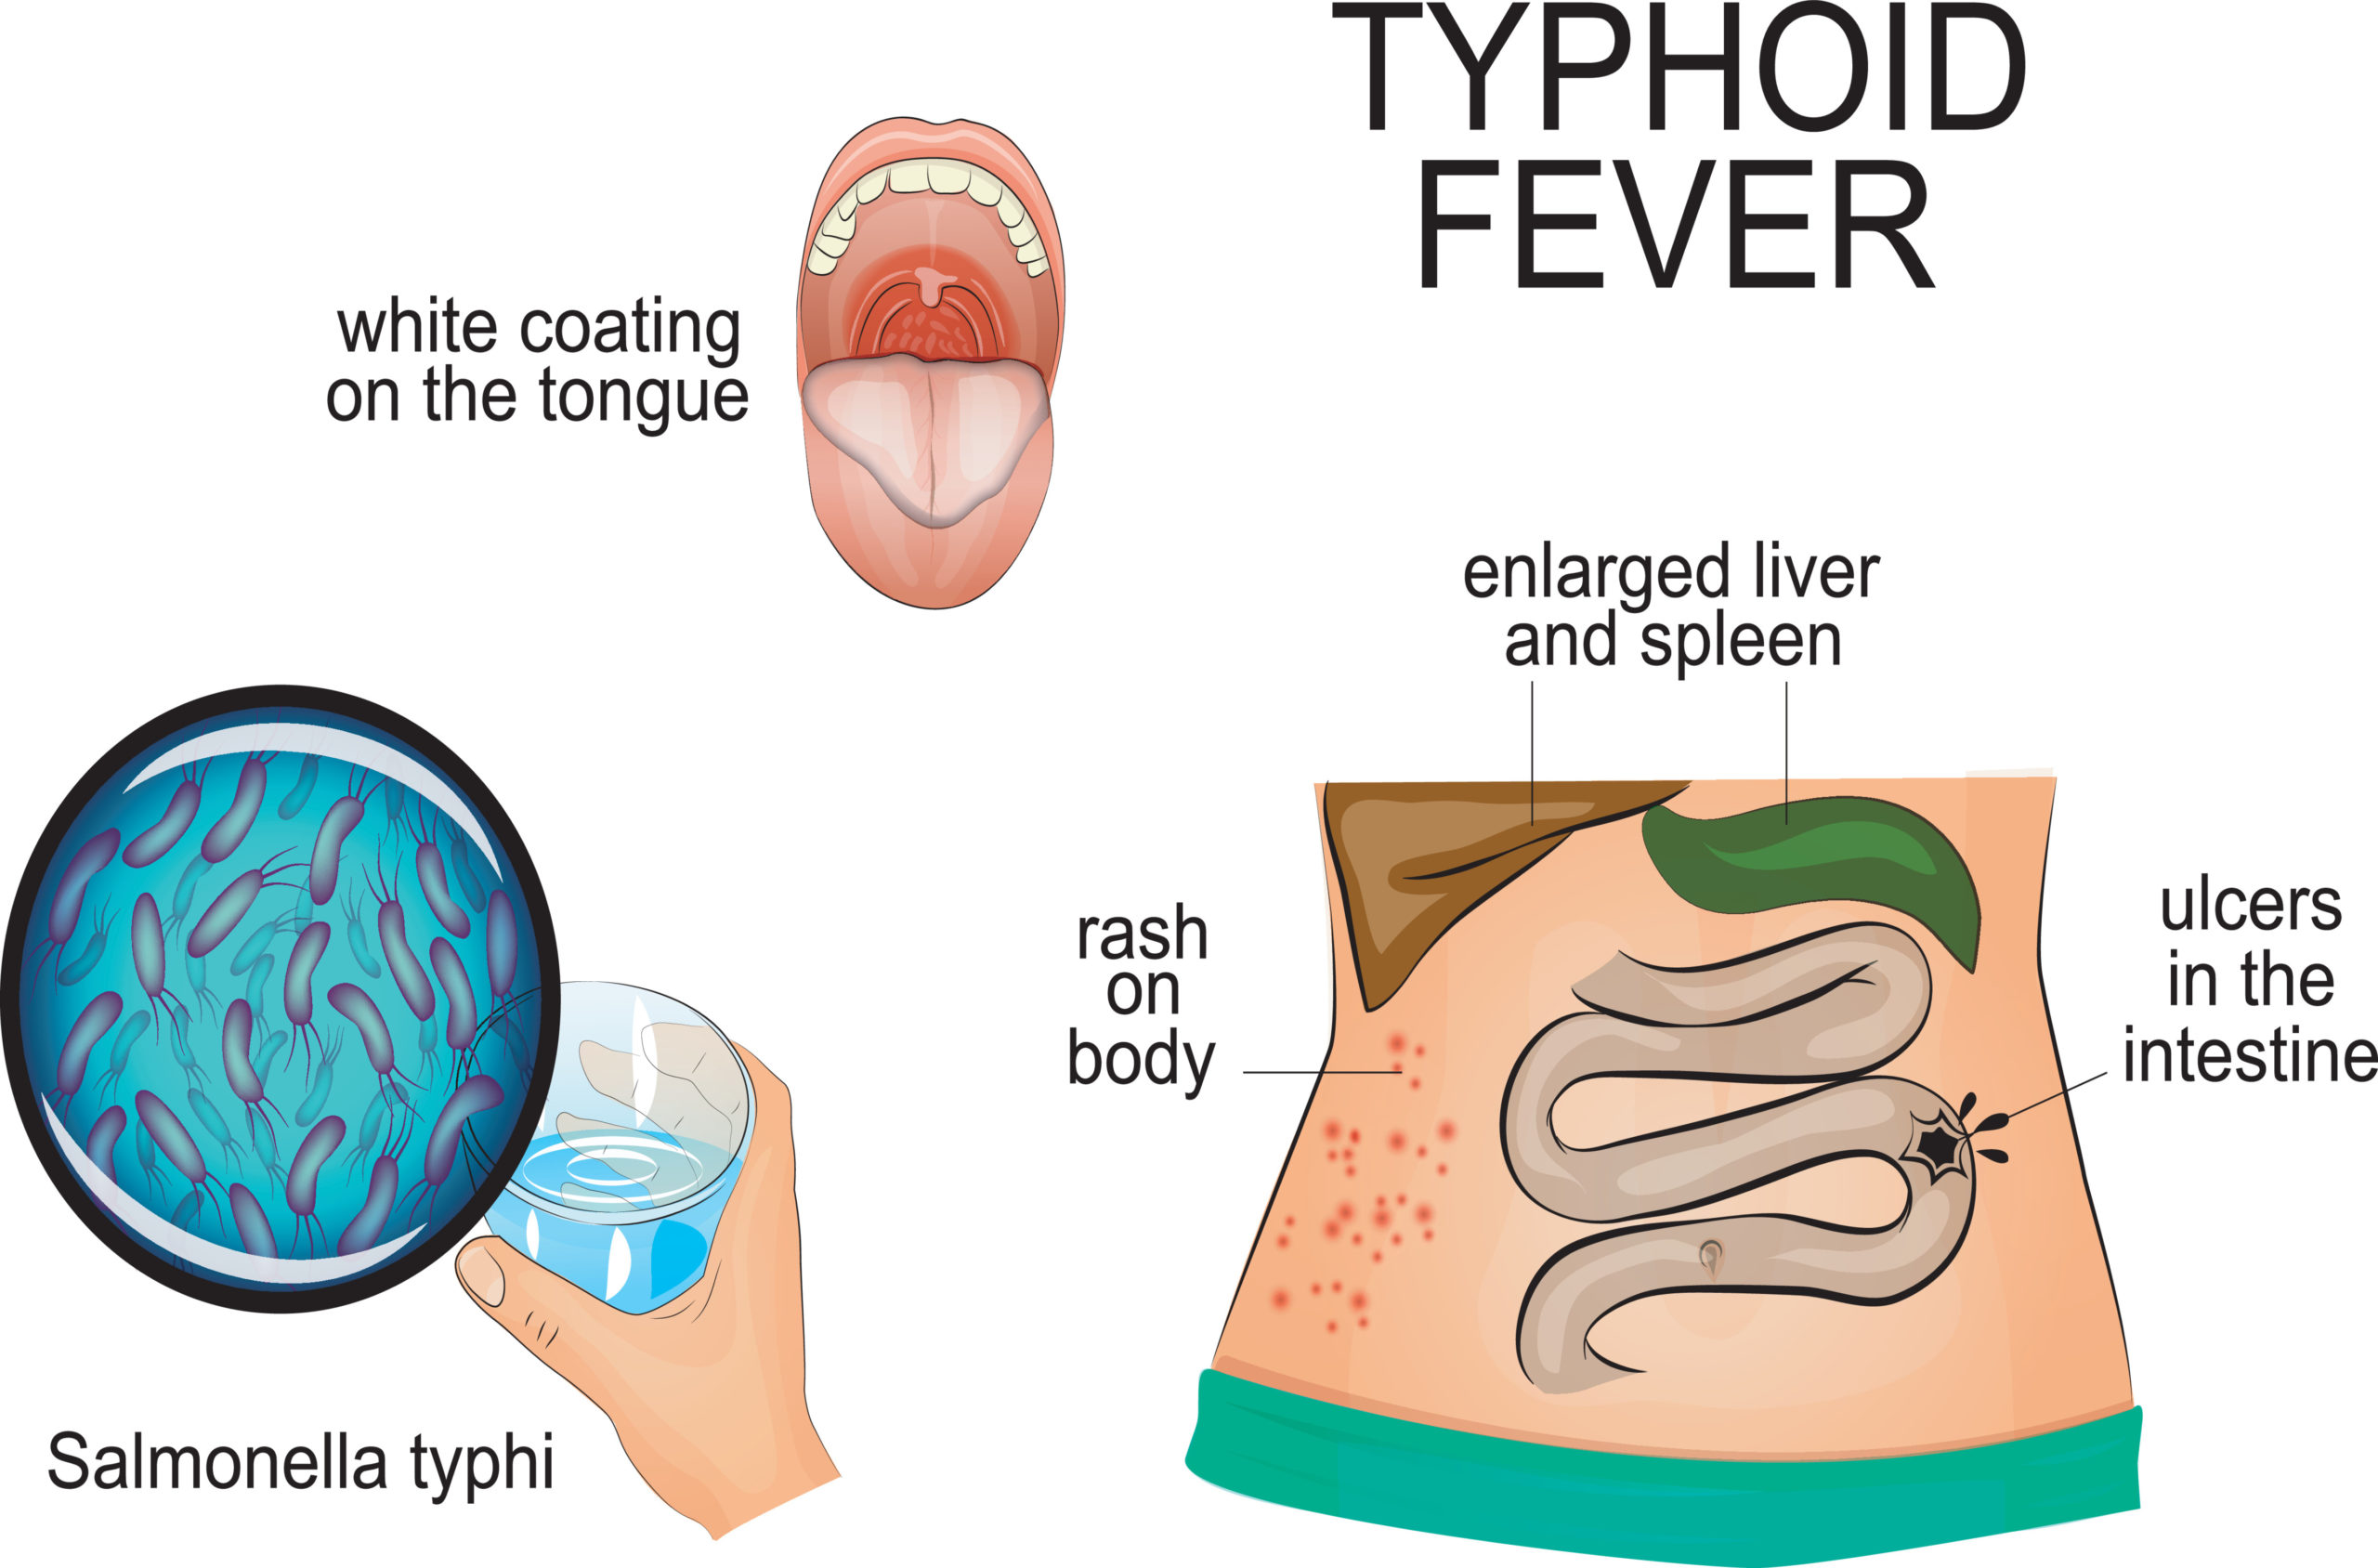
Typhoid fever infographic


Interested in Typhoid Fever? Check out our latest blog on the subject

60 outbreaks of typhoid were reported from 1960 to 1999 – 54 of these (total 957 cases, 4 fatal) following exposure within the United States. Five drinking water-associated outbreaks of this disease were reported from 1971 to 2006.

The best-known clusters of typhoid fever in history were those ascribed to Mary Mallon (also known as”Typhoid Mary”), a chronic carrier who was responsible for 9 outbreaks (54 cases, 4 fatal) in the New York area from 1900 to 1915.

A chronology of notable outbreaks:

1843 – Outbreaks of typhoid were reported in New York City and Boston.
1898 – An outbreak of typhoid was reported in Florida.
1909 – Another outbreak was reported in an “infant asylum” in Baltimore, Maryland.
1911 – An outbreak of typhoid was reported in Yakima, Washington.
1913 (publication year) – An outbreak was reported in Illinois.
1913 (publication year) – An outbreak of paratyphoid fever in Massachusetts was ascribed to contaminated milk.
1936 (publication year) – An outbreak in Philadelphia, Pennsylvania was associated with supper.
1937 (publication year) – An outbreak was reported in Michigan.
1947 – An outbreak (4 cases) of typhoid in Alaska was associated with a commercial air flight.
1953 (publication year) – An outbreak of typhoid was reported in rural New York.
1956 – An outbreak was reported in the Midwest.
1959 – An outbreak of typhoid was reported among migrant workers in Virginia.
1964 – An outbreak of typhoid fever was reported in Atlanta, Georgia.
1967 – An outbreak (31 cases) was reported among students at a university in California.
1970 – An outbreak (81 cases) was reported among passengers aboard a British ship traveling to Canada and the United States.
1972 to 1973 – An outbreak (1,515 cases, 39 fatal) was reported in Mexico City in 1972; with an additional 667 cases from January to June 1973. A related outbreak (80 cases) was reported in the United States.
1973 – An outbreak (230 cases) in Dade Country, Florida may have originated from water contaminated by a typhoid carrier.
1981 – An outbreak (80 cases) of typhoid at a restaurant in Texas was associated with contaminated “barbacoa” (a mixture of muscle, lips, ears, tongue, and eyes from steamed bovine heads).
1981 – An outbreak (6 cases) on an Indian reservation was linked to a typhoid carrier.
1981 – An outbreak (18 cases, 0 fatal) in Michigan was assumed to be related to a typhoid carrier.
1986 – An outbreak at a restaurant in Maryland was caused by contaminated shrimp. {p 3384930}
1989 – An outbreak (43 cases) of typhoid at a hotel in New York was ascribed to contaminated orange juice.
1990 – An outbreak (17 cases) of food-borne typhoid followed a family gathering in Washington State. {p 2120571}
1990 – An outbreak (24 cases, 16 confirmed) was associated with a family picnic in Maryland.
1998 to 1999 – An outbreak (16 cases or more) in Florida was ascribed to frozen mamey (a tropical fruit) imported from Honduras and Guatemala.
2000 – An outbreak (7 cases) in Indiana, Ohio, and Kentucky occurred among men who have sex with men.
2000 – An outbreak (7 cases) in New York City was traced to an infected restaurant employee.
2005 – An outbreak (2 cases) in New York City was related to a carrier from Haiti.
2009 – An outbreak (3 cases) of typhoid was reported in Tennessee.
2010 – An outbreak (12 cases) in California and Nevada was ascribed to the ingestion of contaminated mamey fruit pulp imported from Guatemala.

The background data used in this blog post was abstracted from the GIDEON e-book series. [1,2]

References:
1. Berger SA. Infectious Diseases of the United States, 2013. 1119 pages, 470 graphs, 11030 references. Gideon e-books
2. Berger SA. Typhoid and Enteric Fever: Global Status, 2013. 258 pages, 401 graphs, 728 references. Gideon e-books

Note featured on ProMED


Did you like this article? 

Read Next: Examining Salmonella typhi and Typhoid Fever

Find more of our latest content here

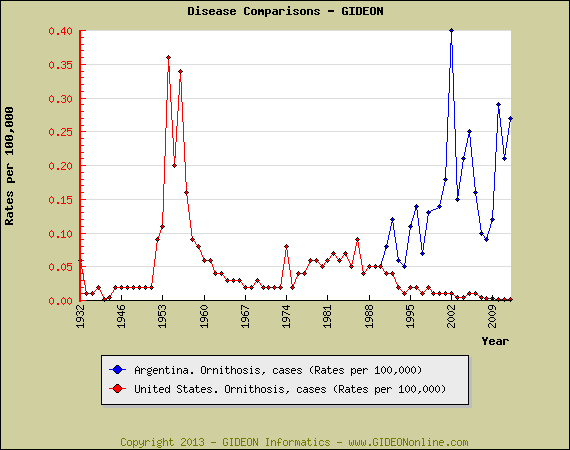
Psittacosis in Argentina

Rates of psittacosis in Argentina have been increasing in recent years, with current levels similar to those encountered in the United States during the outbreaks of 1954 to 1956. [1,2] See graph [3]:

Ornithosis-Argentina

References:
1. Berger SA. Infectious Diseases of Argentna, 2013. 447 pages, 103 graphs, 2145 references. Gideon e-book series, https://www.gideononline.com/ebooks/country/infectious-diseases-of-argentina/
2. Berger SA. Ornithosis: Global Status, 2013. 38 pages, 30 graphs, 212 references. Gideon e-book series, https://www.gideononline.com/ebooks/disease/ornithosis-global-status/
3. Gideon Graph Tool, see tutorial at https://www.gideononline.com/wp-content/uploads/Gideon-Graphs.pps

Note featured on ProMED

GIDEON Sign In