GIDEON blog

Free Demo ► Latest Updates ► Video Tutorials ►
Subscribe , j x

Scrub Typhus in India

The following background information on Scrub typhus in India is abstracted from Gideon www.GideonOnline.com and the Gideon e-book series. [1]

Rickettsia tsutsugamushi is one of seven Rickettsia and Rickettsia-like organisms which have been associated with human infection in India (the others are Rickettsia sibirica, Rickettsia conorii subsp. indica, Candidatus Rickettsia kellyi, Rickettsia typhi, Rickettsia prowazekii and Coxiella burnetii)

Epidemics of scrub typhus were previously reported among troops stationed in the north and east.

Risk factors include living close to bushes and wood piles, work on farms, observation of rodents at home and at work, and raising domestic animals (Darjeeling, West Bengal, 2009 publication)

Exported cases:
– Three cases of imported scrub typhus were reported in the United States during 1983 to 1988 – all originating in India.
– In 2002, a Belgian traveler developed scrub typhus following a trip to India.

17 fatal cases were reported in Himachal during 2001 to 2002.
– 21 cases (3 fatal) were reported in Himchal Pradesh during 2004.
– Nine cases were confirmed in Uttarakhand (2010 publication)
– 29 cases were reported from a hospital in Manipal, Karnataka during 2009.

Prevalence surveys:
24.1% of febrile hospitalized patients in Vellore (2006 publication)
15% of children below age 14 hospitalized for fever in Tamil Nadu (2003 to 2004)
14.3% of children hospitalized with fever and at least one suggestive feature of rickettsial infection (central India, 2011 publication)
37.5% of febrile malaria-negative patients in Tamil Nadu in 2004, and 9.2% in 2005
47.5% of patients hospitalized for acute undifferentiated febrile illness in Vellore, Tamil Nadu (2010 publication)

The principal vector is Leptotrombidium deliense.
– Schoengastiella ligula mites infesting shrews (Suncus murinus) were identified as vectors during an outbreak in Kurseong, Darjeeling.
–
Notable outbreaks:
2001 to 2002 – An outbreak (28 cases, 3 fatal) was reported in Tamil Nadu.
2003 – An outbreak (225 cases, 19 fatal) was reported in Himachal Pradesh.
2006 to 2008 – An outbreak (50 cases) was reported in Pondicherry.
2007 – An outbreak (38 cases) was reported in Bishnupur district, Manipur.
2009 to 2010 – An outbreak (80 cases, 5 fatal) was reported in Meghalaya.
2011 – Outbreaks were reported in Himachal Pradesh (200 cases, 13 fatal) and Nagaland (9 cases, 3 fatal).

References:
1. Berger SA. Infectious Diseases of India, 2011. 480 pp, 65 graphs, 3503 references. Gideon e-books

https://www.gideononline.com/ebooks/country/infectious-diseases-of-india/

Reproduced on ProMED
Hepatitis C in China: Prevalence Surveys

The following background information on HCV in China is abstracted from Gideon www.GideonOnline.com and the Gideon e-book series. [1,2] Primary references are available on request.

PREVALENCE SURVEYS (ANTIBODY AND / OR VIRAL RNA):

GENERAL POPULATION:
Hepatitis C accounts for 8% of acute hepatitis Cases in Nanchong (2004 publication) to 18.1% of acute hepatitis in the Beijing area (1995 to 2000)
4.07% of the general population in 1997; 3.0% in 1999 (estimates)
0.58% nationwide (six regions, 2009 publication)
0.15% of adults in Liangshan Prefecture, Sichuan Province (2011 publication)
8.2% of rural adults in Shanxi – 27.7% of former commercial blood / plasma donors (2003)
0.9% of persons in Anyang (2006 to 2008)
0.5% of normal subjects (and 5.0% of liver disease patients) in Nanjing (1997 publication)
31.0% of persons in central Tibet (2001)
1.1% to 2.7% of the general population of Beijing
9.6% of elderly adults in Linxian (rural Henan) (2000)

BLOOD DONORS:
8.68% of blood donors – 12.87% prior to 1998 (15.78% during 1994 to 1995) , and 1.71% after 1998 (analysis of 265 studies, 2011 publication)
0% to 1.1% of volunteer blood donors (1997)
29.19% of non-remunerated blood donors in Shaoxing (2007 publication)
30% of professional blood donors in Hebei and Inner Mongolia
1.5% to 3% in professional blood donors from Liaoning and Anhui (1993 publication)
0.49% of blood donors in Chongqing (2008 publication)
0.53% of blood donors in Chengdu (2006 to 2007)
0.335% of voluntary blood donors in Guangzhou (2004 to 2007)
12.7% of former commercial blood / plasma donors in rural Shanxi Province (2004)

INJECTING DRUG USERS (IDU): As of 2011, an estimated 10 million injecting drug users worldwide are seropositive toward Hepatitis C virus – including 1.6 million in China.
32.35% of IDU (15 cities, 2011 publication)
4.0% of IDU (2010 publication)
66.97% of IDU (range 11.43% in Shaanxi to 90.77% in Hubei) vs. 18.37% of non-injecting drug users (literature review, 2009)
61.4% of IDU in China, with highest rates in Hubei, Yunnan, Guangxi, Hunan and Xinjiang (2008 publication)
71.0% of IDU in Sichuan (2002); 67.49% in Guangzhou
69.7% of IDU in Wuhan (2006 publication)
63.2% of IDU in Dongguan, Guangdong (2008)
71.6% of IDU in Guangdong (2010 publication)
94.3% of IDU on methadone maintenance, in Wuhan (2008 publication)
69.0% of Chinese and 48.1% of Burmese IDU in the China-Burma border region (2011 publication)
56.9% of HIV-positive IDU (2003 publication)

HIV-POSITIVE PATIENTS:
78.6% of HIV-positive former blood donors (Hubei, 2008 publication)
76.4% of HIV-positive patients vs. 2.5% of HIV-negative individuals (Shanxi Province, 2010 publication)
41.83% of HIV-positive patients (2007 to 2008)
59.0% of HIV-positive patients (Shanxi, Zhejiang, Yunnan and Xinjiang, 2011 publication)
9.6% of HIV-positive children receiving ART (2009 publication)
19.4% of HIV-positive patients receiving AART (Beijing, 2005 to 2007)

83.6% of AIDS patients were found to be co-infected with hepatitis C, 2.3% singly co infected with hepatitis B, and 5.5% co infected with HIV/HCV/HBV; 8.6% were infected with HIV only. (Zhengzhou, publication 2006)

MEN WHO HAVE SEX WITH MEN (MSM)
0.4% of MSM in 2004; 5.2% in 2006 (Beijing)
0.8% of MSM in Beijing (2005 to 2006)
0.4% of MSM in Beijing (2008 publication)
0.7% of MSM in Jiangsu (2006 to 2007)
0% of MSM in Taizhou city, Zhejiang province (2008 publication)

COMMERCIAL SEX WORKERS (CSW) / CLIENTS:
6.8% of CSW in Kunming, Yunnan (2008 publication)
8.7% of male clients of CSW in Sichuan (2010 publication)

PATIENTS WITH HEPATITIS / LIVER DISEASE:
14% to 27% of patients with chronic hepatitis
16% of hepatitis B carriers
43% of patients with cirrhosis
39% of patients with hepatocellular carcinoma

HEMODIALYSIS PATIENTS:
54% of hemodialysis patients and 6% of commercial blood donors – rates somewhat higher among carriers of Hepatitis GB-C. (Beijing, 1996)
41% of hemodialysis patients (meta-analysis, 2009 publication)
17.2% of hemodialysis patients in Zhejiang (2009 publication)

OTHER:
1.72% of patients with oral lichen planus (2010 publication)
1.30% of subjects with thyroid autoantibodies vs. 0.53% of a control group (2011 publication)

Primary liver cancer, one of the principal sequelae of Hepatitis C, is the second most common malignancy in China, responsible for 360,000 incident cases, and 350,000 deaths per year. Mortality rates of liver cancer were 17.6 and 7.3 per 100,000 for males and females during 1973 to 1975, 29.0 and 11.2 per 100,000 during 1990 to 1992, and 37.55 and 14.45 per 100,000 during 2004 to 2005.

References:
1. Berger SA. Infectious Diseases of China, 2011. 635 pp, 253 graphs, 3049 references. Gideon e-books, https://www.gideononline.com/ebooks/country/infectious-diseases-of-china/
2. Berger SA. Hepatitis C: Global Status, 2011. 164 pp, 160 graphs, 1500 references. Gideon e-books, https://www.gideononline.com/ebooks/disease/hepatitis-c-global-status/

Note featured on ProMED

Viral Hepatitis in the Czech Republic

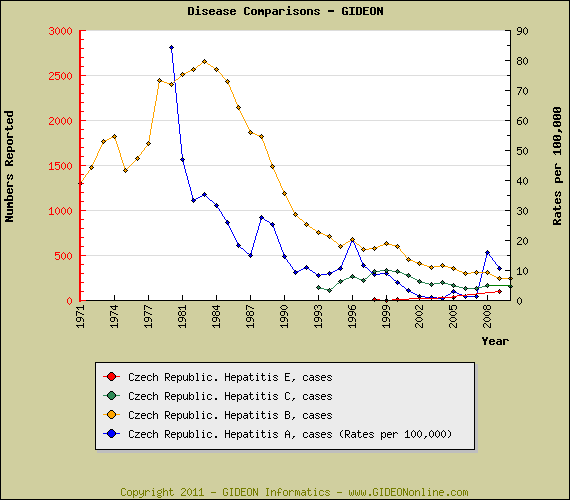
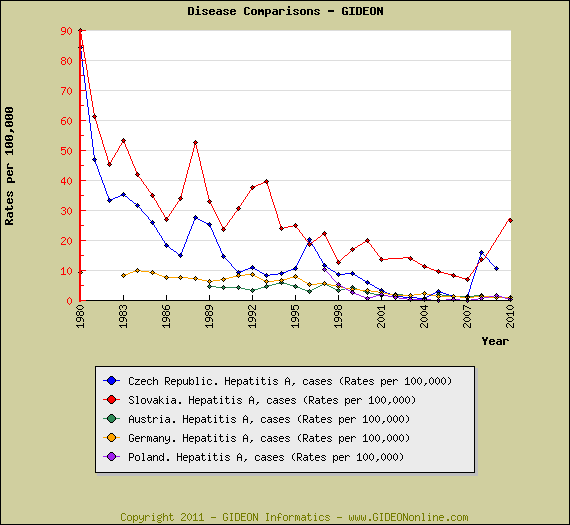
Rates of Hepatitis A in the Czech Republic and neighboring countries have decreased significantly since the 1980’s, and were exceeded by those of Hepatitis B and C for much of the past decade [1,2] See graphs [3]:

References:
1. Berger SA. Infectious Diseases of the Czech Republic, 2011. 424 pp, 139 graphs, 1192 references. Gideon e-books, https://www.gideononline.com/ebooks/country/infectious-diseases-of-the-czech-republic/
2. Berger SA. Hepatitis A: Global Status, 2011. 163 pp, 180 graphs, 1073 references. Gideon e-books, https://www.gideononline.com/ebooks/disease/hepatitis-a-global-status/
3. Gideon graph tool tutorial at https://www.gideononline.com/wp-content/uploads/Gideon-Graphs.pps )

Note reproduced on ProMED

Equine Encephalitis in Argentina

Several equine viral agents with potential for human infection have been reported in Argentina.. The following background information is abstracted from Gideon www.GideonOnline.com and the Gideon e-book series. [1,2]

1. TOGAVIRIDAE
A. Eastern equine encephalitis:
Seropositivity toward eastern equine encephalitis virus was demonstrated in wild and domestic birds, wild mammals, and horses during 1977 to 1980.
– The principal mosquito vector is Aedes (Ochlerotatus) taeniorhynchus.
– Additional vectors include Culex nigripalpus, C. caudelli, C. spissipes and C. taeniopus.
– Eastern equine encephalitis has been reported from Buenos Aires.

Notable outbreaks:
1981 – An outbreak if eastern equine encephalitis was reported among equines in Santiago del Estero Province.

B. Western equine encephalitis:
An epizootic was reported during 1982 to 1983, with continued cases to 1986.
– Ochlerotatus (Aedes) albifasciatus is the presumed vector in Argentina.
– During the epidemic of 1982 to 1983, WEE virus was also demonstrated in Anopheles albitarsis, Mansonia species and Psorophora pallescens.

C. Venezuelan equine encephalitis
Complement-fixing antibodies toward Venezuelan equine encephalitis virus have been demonstrated among humans in Corrientes and Chaco (1983 publication)
– Related agents, Pixuna and Rio Negro viruses, have been identified among rodents in Tucuman Province.

Seroprevalence surveys:
51.6% of persons on General Belgrano Island, Formosa Province (NT, 1993 publication)
30% to 70% of persons on General Belgrano Island, Formosa Province (NT, 2003 publication)

2. RHABDOVIRIDAE
A. Calchaqui virus:
Seropositivity of humans and horses toward Calchaqui virus has been demonstrated in Santa Fe Province. Calchaqui virus has also been identified in a local mosquito.

B. Rabies (an extensive note regarding rabies in Argentina is available on request)

C. Vesicular stomatitis virus infection has been reported among animals in Argentina (2011 publication)

3. BUNYAVIRIDAE
A. Cache Valley, Kairi and Bunyamwera viruses:
Seroprevalence surveys:
5.7% of human sera in Cordoba are seropositive toward Cache Valley virus and 5.92% toward Kairi virus (2004 to 2005)
13.3% of horses in Santa Fe and Cordoba are seropositive toward Kairi virus , and 40% toward Cache Valley virus (1983 to 1984)
6.6% of free-ranging birds in Cordoba City were seropositive toward Bunyamwera virus in 2004, 13.8% in 2005

4. FLAVIRIDAE
A. West Nile fever virus:
West Nile fever virus was detected for the first time in Argentina in 2006 – two horses in San Antonio de Areco and one in San Isidro, Buenos Aires Province.
– Infection was documented in free-ranging birds during 2005 to 2006.
– The country’s first cases of human infection were reported in 2006 – one case in the city of Marcos Juarez in Cordoba Province and 3 additional cases in Chaco province.

References:
1. Berger SA. Infectious Diseases of Argentina, 2011. 417 pp, 96 graphs, 1516 references. Gideon e-books, https://www.gideononline.com/ebooks/country/infectious-diseases-of-argentina/
2. Berger SA. Equine encephalitis: Global Status, 2011. 38 pp, 17 graphs, 282 references. Gideon e-books, https://www.gideononline.com/ebooks/disease/equine-encephalitis-global-status/

Campylobacter in the United Kingdom

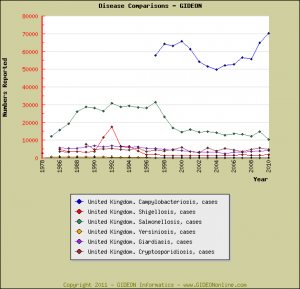
Reports of campylobacteriosis in the United Kingdom have increased since the 1990’s, and continue to exceed the combined incidence of all other reportable gastrointestinal pathogens [1,2]: see graph [3] .

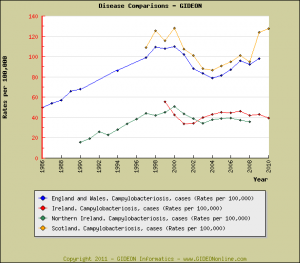
Campylobacteriosis rates in Scotland are similar to those of England and Wales, while those of Northern Ireland more closely resemble rates reported by the Irish Republic. [1,2] See graph [3] :

References:
1. Berger SA. Infectious Diseases of the United Kingdom, 2011. 992 pp, 786 graphs, 2594 references. Gideon e-books, https://www.gideononline.com/ebooks/country/infectious-diseases-of-the-united-kingdom/
2. Berger SA. Campylobacteriosis: Global Status, 2011. 94 pp, 93 graphs, 717 references. Gideon e-books, https://www.gideononline.com/ebooks/disease/campylobacteriosis-global-status/
3. Gideon graph tool tutorial at https://www.gideononline.com/wp-content/uploads/Gideon-Graphs.pps )

Note reproduced by ProMED

Trichinosis in Chile

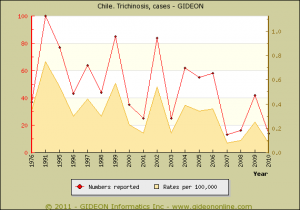
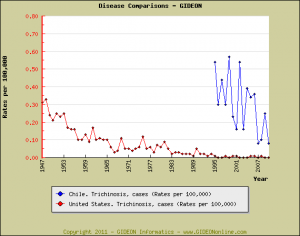
Rates of trichinosis in Chile have been steadily decreasing for over 30 years, but are still at levels reported in the United States during the 1950’s (see graphs). [1]

The following background is abstracted from Gideon www.GideonOnline.com and the Gideon e-book series. [2,3] (primary references are available on request)

Highest incidence of trichinosis in Chile is reported in the Metropolitan, VI, VIII and X Regions.
– Disease rates were 1.4 per 100,000 during the 1960’s, 0.7 per 100,000 during the 1980’s, 0.3 per 100,000 during 1993 and 1994, and 0.5 per 100,000 in 1995.
– 631 cases of trichinosis (4 fatal) were identified through active case-finding during 1991 to 2000.

Prevalence surveys:
2.2% of the population at autopsy in 1966; 3.4% in 1972; 2.8% in 1982; 0.8% in 1997
2% of the population at autopsy (Santiago, 1992)
1.67% of persons in Concepcion and Arauco at autopsy (1997 publication)

Seroprevalence surveys:
1.5% of the population (1983 to 1994)
4.7% in San Juan de la Costa County. Osorno, X Region (1990 to 1991)

Vehicles:
– Pig infestation rates were 0.683 per 1,000 during 1980 to 1984, 0.315 per 1,000 during 1985 to 1989; 0.115 per 1,000 during 1990 to 1996.
– 0.017% of pigs were found to be infested in 1991; 0.004 during 1998 to 2000.
– The country’s first case associated with wild boar (Sus scrofa) consumption was published in 2005.

Notable outbreaks:
1962 (publication year) – An outbreak of trichinosis was reported among members of a family in Santiago de Chile.
1973 (publication year) – An outbreak was reported in Santiago.
1982 (publication year) – An outbreak was reported in Concepcion.
1992 – An outbreak (36 cases) in Purranque County, X Region was ascribed to infested pork.
1999 – An outbreak (21 cases) in southern Chile was ascribed to infested pork.
1999 to 2000 – An outbreak was reported among pigs in the area southwest of Santiago
2010 – An outbreak (11 cases) was reported in Valdivia and La Union.

References:
1. Gideon graph tool tutorial at https://www.gideononline.com/wp-content/uploads/Gideon-Graphs.pps )

Berger SA. Infectious Diseases of Chile, 2011. 371 pages, 89 graphs, 1213 references. Gideon e-book series, https://www.gideononline.com/ebooks/country/infectious-diseases-of-chile/

3. Berger SA. Trichinosis: Global Status, 2011. 82 pages, 68 graphs, 695 references. Gideon e-book series,
https://www.gideononline.com/ebooks/disease/trichinosis-global-status/

Dirofilariasis in Russia

The following background information on dirofilariasis is abstracted from Gideon www.GideonOnline.com.

Subcutaneous dirofilariasis is reported in Astrakhan, Volgograd, Nijegorodskiy, Saratov, Rostov, Chelyabinsk and several other oblasts.
– 564 cases were reported between 1915 and 2008 , of which 68.5% were in the endemic area of Russia
– 114 cases of subcutaneous infection by Dirofilaria repens were reported for the former Soviet Union during 1915 to 1996.
– All infections were acquired below 53 degrees N. latitude, and the majority were diagnosed during January to June.

11 cases were reported in the Moscow region during 2000 to 2002, many involving the male genitalia.
– 129 cases of human subcutaneous dirofilariasis and 2 of pulmonary dirofilariasis were identified in the Rostov region during 2000 to 2009.
– 14 cases of human subcutaneous dirofilariasis due to Dirofilaria repens were confirmed in Rostov-on-Don during February 2003 to July 2004.
– 2 cases were reported in the Kirov region in 2008
– 8 cases of Dirofilaria repens infection were reported in the Primorye Territory over a three-year period (2011 publication)

In recent years, Dirofilaria immitis has been replacing Dirofilaria repens as a dog pathogen in the Rostov region.

Prevalence surveys:
20.25% of dogs in the Rostov region – of these, 44.7% D. repens, 30.3% D. immitis and 25.0% coinfection by both species (2011 publication)

Seroprevalence surveys:
10.4% of blood donors and 19% of policemen in the Rostov region (2011 publication)

Tuberculosis: Reported Disease Trends vs. BCG Vaccine Uptake

A recent posting in ProMED noted that rates of tuberculosis in North Korea have been increasing at an alarming rate in recent years, in spite of a parallel improvement in the uptake of BCG vaccine in that country. Indeed, one of the oldest controversies in medicine concerns the effectiveness of BCG vaccination to prevent tuberculosis. As of 2011, over 85% of countries continue to routinely vaccinate infants with BCG vaccine.

The following analysis was undertaken to collate concurrent trends in tuberculosis rates and BCG vaccine uptake among countries which employ the vaccine. Data for tuberculosis incidence were obtained from the Gideon database (www.GideonOnline.com) which is largely based on reporting from individual Health Ministry reports and publications of the World Health Organization. Disease rates per 100,000 population are automatically generated by Gideon, and all charts summarized in a related e-book. [1] Country-specific estimates of BCG coverage were obtained from a WHO website: http://apps.who.int/immunization_monitoring/en/globalsummary/timeseries/tscoveragebcg.htm , and supplemented by individual reporting data at http://www.who.int/countries/en/ .

Individual charts were generated which plot tuberculosis rates and estimates of vaccine uptake. [2] Charts were then collated into three categories:

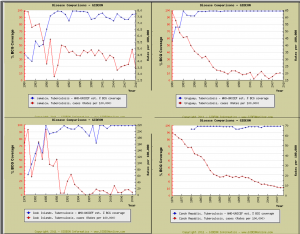
A) Tuberculosis rates appear to diminish in parallel with high (>=85%) and / or increasing vaccine uptake (examples in graph A)

“>

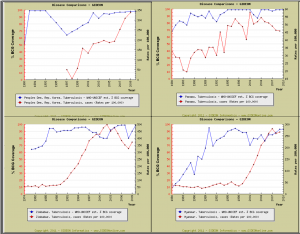
B) tuberculosis rates appear to increase in parallel with high and / or increasing vaccine uptake (examples in graph B)

“>

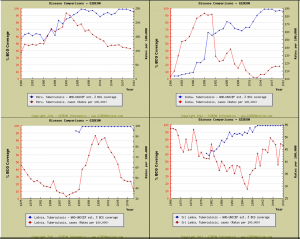
C) no consistent similarity is apparent between trends in tuberculosis rates and vaccine uptake (examples in graph C).

“>

The latter graph also includes examples of countries (Latvia, Peru and India) in which vaccine update was initially associated with increasing disease rates, and subsequently decreasing rates; and others (Sri Lanka) in which these effects were reversed.

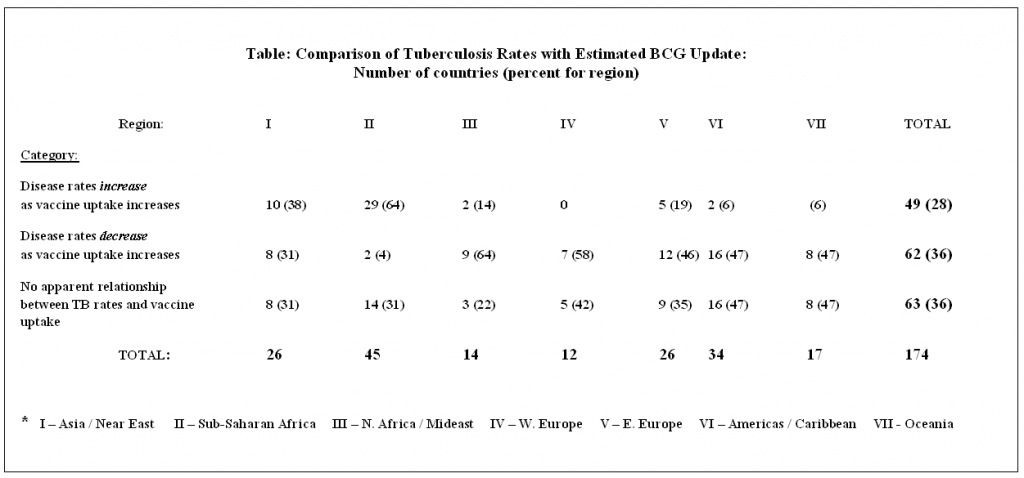
No attempt was made to further examine these data using tests of statistical significance, trend analysis, etc. In the following table, assignment of individual countries is based simply on the existence of overt visible trends between disease rates and vaccine uptake:


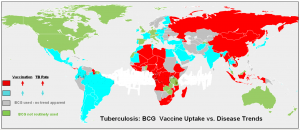
Data presented in the table suggest that only 62 countries (36%) which employ BCG vaccination have demonstrated decreasing tuberculosis rates in parallel with increased vaccine uptake; while, 49 countries (28%) have actually experienced increasing disease rates despite adequate vaccine usage. There is no apparent relationship between vaccination and disease rates in the remaining 63 countries (36%) . Countries in which a paradoxical increase in tuberculosis has paralleled expanded vaccine uptake are concentrated in Africa, Asia and the Near East; while countries in which increasing vaccine uptake is paralleled by decreased incidence are concentrated in North Africa, the Middle East, Western Europe, Oceania and the Americas region. These trends are depicted in the following map:


The above analysis is not intended to imply a causal relationship between tuberculosis incidence and vaccine uptake. In fact, any impact of BCG vaccination on disease incidence might only become apparent after several years, given the long “incubation period” associated with reactivation tuberculosis. Additional factors which might impact on the incidence of tuberculosis in many of these countries include AIDS, malnutrition, crowding, civil conflict, drug resistance, nature of laboratory facilities, and systems for case-finding, patient isolation and follow-up.

References:
1. Berger SA. Tuberculosis: Global Status, 2011. 568 pages, 894 graphs, 1142 references. Gideon e-books, https://www.gideononline.com/ebooks/disease/tuberculosis-global-status/
2. Gideon graph tool tutorial at https://www.gideononline.com/wp-content/uploads/Gideon-Graphs.pps

Posted by ProMED

Venereal Diseaes in the United States

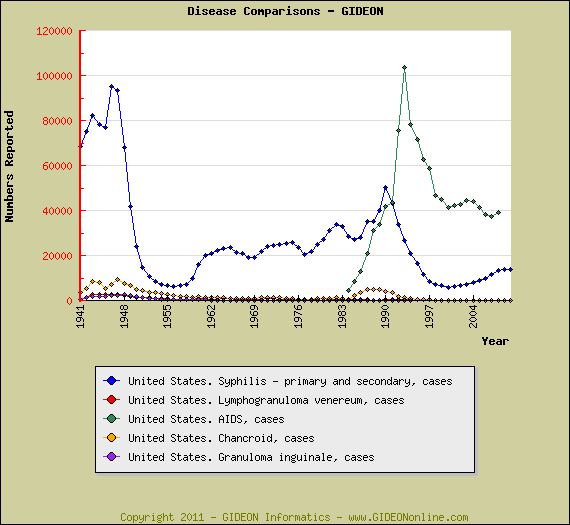
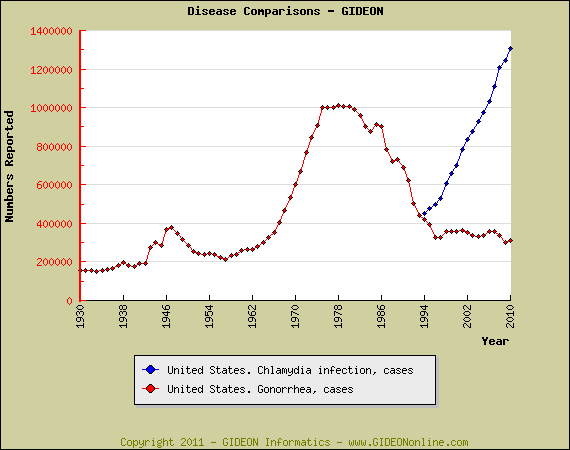
The following graphs summarize six decades of venereal diseases data for the United States. As described in a recent ProMED report, the incidence of syphilis has been rising since 1999. 1,2 Note that reports of chlamydial infection have increased arithmetically since the disease became reportable in 1994.


(Graph tool tutorial at
https://www.gideononline.com/wp-content/uploads/Gideon-Graphs.pps )

References:
1. Berger SA. Infectious Diseases of the United States, 2011. 1030 pages, 464 graphs, 8237 references. Gideon e-books, https://www.gideononline.com/ebooks/country/infectious-diseases-of-the-united-states/
2. Berger SA. Syphilis: Global Status, 2011. 231 pages, 336 graphs, 861 references. Gideon e-books, https://www.gideononline.com/ebooks/disease/syphilis-global-status/

Featured on ProMED

Tuberculosis in North Korea

[comment on Tuberculosis, drug resistance – North Korea ]

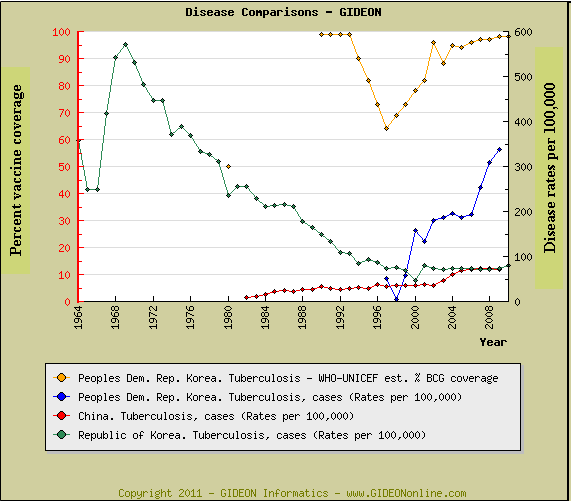
Rates of tuberculosis in North Korea continue to increase at an alarming rates, and are currently similar to those reported in South Korea during the 1970’s (see graph below). Strangely, these increases have paralleled WHO estimates of BCG vaccine uptake in this country (yellow line in graph). 1,2

(Graph tool tutorial at https://www.gideononline.com/wp-content/uploads/Gideon-Graphs.pps )

References:
1. Berger SA. Infectious Diseases of North Korea, 2011. 315 pp, 25 graphs, 840 references. Gideon e-book series, https://www.gideononline.com/ebooks/country/infectious-diseases-of-north-korea/
2. Berger SA. Tuberculosis: Global Status, 2011. 568 pages, 894 graphs, 1142 references. Gideon e-book series, https://www.gideononline.com/ebooks/disease/tuberculosis-global-status/

Featured on ProMED

GIDEON Sign In