GIDEON blog

Free Demo ► Latest Updates ► Video Tutorials ►
Subscribe , j x

Hepatitis B and Liver Cancer: California

[comment on Hepatitis B – United States of America (California) Liver Cancer]

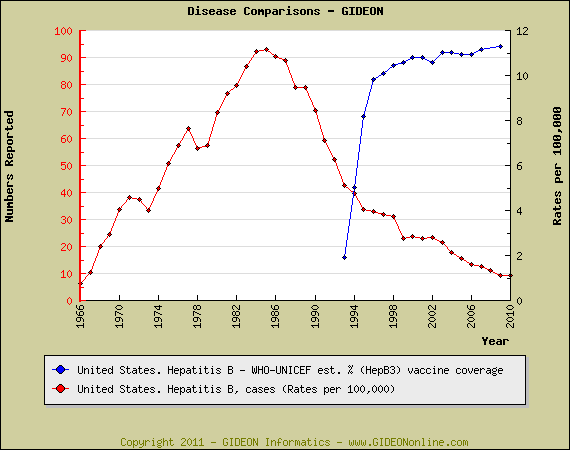
Changes in vaccination policy may not solve California’s “liver cancer epidemic.” In the United States as a whole, rates of Hepatitis B were had already declined significantly before the demonstration of effective vaccine uptake [1,2] See graph :

Vaccination of infected Asian immigrants cannot alter disease progression or public health risk among Asian immigrants who were already infected before arriving to California. The focus must be on testing and counseling of pregnant carriers and high-risk contact groups in this community. In any case, possible effects of increased vaccination on rates of liver cancer might not be apparent for several years, given the natural lag period from infection to tumor.

(See the Graph tool tutorial at www.GIDEONonline.com/wp/wp-content/uploads/Gideon-Graphs.pps )

References:
1. Berger SA. Infectious Diseases of the United States, 2011 publication. 1030 pp, 464 graphs, 8237 references. Gideon e-books, https://www.gideononline.com/ebooks/country/infectious-diseases-of-the-united-states/
2. Berger SA. Hepatitis B: Global Status, 2011. 327 pp, 405 graphs, 1517 references. Gideon e-books, https://www.gideononline.com/ebooks/disease/hepatitis-b-global-status/

Note cited by ProMED

Plague in Madagascar

The following background data on plague in Madagascar were abstracted from Gideon www.GideonOnline.com and the Gideon e-book series. [1,2] (Primary references are available on request)

Time and Place:
– Plague was first described in Madagascar in 1898, with cases in the harbor of Tamatave (Toamasina).
– The first epidemic occurred in Majunga in 1902 (142 fatal cases during May to July of that year).
– Subsequent outbreaks were reported in Majunja in 1907 (49 fatal cases), 1924 and 1928.
– The disease reached the central highlands in 1921, and remains endemic to this area at elevations above 800 m.
– Outbreaks of pneumonic plague were reported during 1921 to 1935; and in 1957 (northeast region).
– Plague was first reported in port areas of Madagascar in 1898; with later spread to the high plateau in 1921.
– During 1989 to 1992, 93% of cases were reported from “the plague triangle” located in the Central Highlands and delimited by Ambatondrazaka, Miarinarivo and Fianarantsoa.

Biology and transmission:
– Reservoirs implicated in transmission include the shrews (Suncus murinus) and rats (Rattus rattus).
– Infection has also been identified in hedgehogs (Tenrec ecaudatus).
– Possible flea vectors include Paractenopsyllus pauliani, Synopsyllus fonquerniei and Xenopsylla cheopis.

Incidence:
Two major waves of plague have been reported – with peak incidence in 1932 (3,656 cases) and 1997 (2,863 cases). See graph:
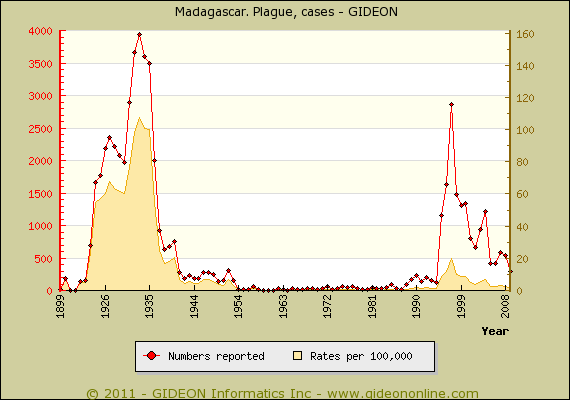
– 10,471 cases were reported during 1935 to 1949 ; 9,227 (448 fatal) during 1957 to 1986; 5,896 (493 fatal) during 1980 to 1997; 11,673 (950 fatal) during 1987 to 2001.
– Of 5,927 suspected cases reported during 1989 to 1995, 1,337 were bacteriologically-confirmed, with a case-fatality rate of 19%.
– 1,702 suspected cases (515 confirmed, 47 fatal) were reported in Mahajanga during 1995 to 1998.
– 91.3% of these cases were characterized as bubonic (67.8% of these involving the inguinal region).

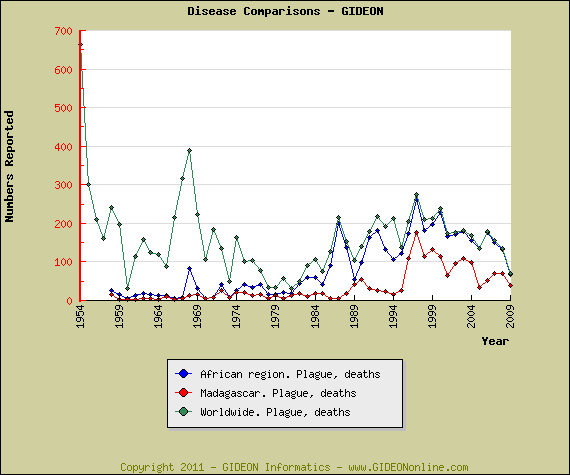
Africa accounts for most of the world’s plague deaths. >=50% of these deaths are reported by Madagascar. See graph:
Seroprevalence surveys:
<1.5% to 15.5% in Majanga City (1997 publication) 0.61% of persons in Mahajanga (anti-F1 antibody, 1999) 3.2% of market vendors in Antananarivo (anti-F1 antibody, 1999) Notable outbreaks: 1982 (publication year) - An outbreak (9 cases) was reported in Tananarive. 1991 - An outbreak was reported in Majunga. 1995 - An outbreak (108 confirmed and presumed cases) was reported in Mahajanga city. 1997 - An outbreak (2,863 cases, 176 fatal) was reported. 1998 - An outbreak was reported in a hamlet in the Ikongo district. 2008 - An outbreak (7 deaths) of pneumonic plague was reported in Toamasina. 2010 - An outbreak (31 cases, 1 fatal) was reported in La Libertad. 2011 - Outbreaks (200 cases, 60 fatal) were reported, including Antananarivo (3 fatal cases) and Antsiranana (16 fatal cases). (outline of Gideon Graph module - see https://www.gideononline.com/wp-content/uploads/Gideon-Graphs.pps )

References:
1. Berger SA. Infectious Diseases of Madagascar, 2011. 49 pp, 47 graphs, 1,029 references. Gideon e-books, https://www.gideononline.com/ebooks/country/infectious-diseases-of-madagascar/
2. Berger SA. Plague: Global Status, 2011. 95 pages, 101 graphs, 485 references. Gideon e-books, https://www.gideononline.com/ebooks/disease/plague-global-status/
Bartonellosis in Peru

The following background information on Bartonellosis in Peru is abstracted from Gideon and the Gideon e-book series. [1] Primary references are available on request.

Seasonality / Distribution:
– South American bartonellosis is primarily found in the Western Andes river valleys at elevations of 500 to 3000 meters – Ancash, La Libertad, Cajamarca and Amazonas.
– Cases are reported at elevations as high as 3,375 meters (town of Huasta).
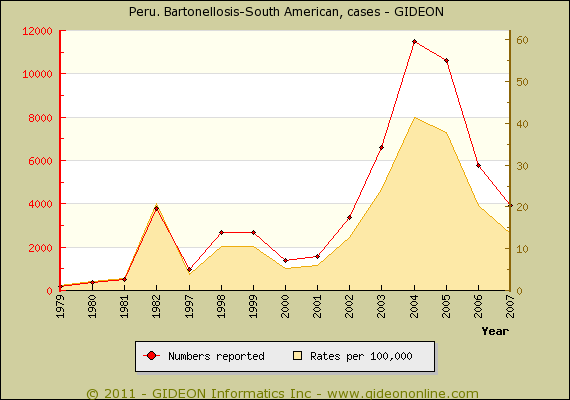
– During 2004 to 2007, 36.1% of cases were reported from Cajamarca, 30.3% Ancash, 17.3% La Libertad and 8.0% Amazonas

Indidence – see graph:

Chronology:
1871 – 7,000 workers died of bartonellosis during the building of a railway line from Lima to Oroya. (thus the term, “Oroya fever.”)
1906 – An outbreak (200 fatal cases) was reported among tunnel workers.
1959 – An outbreak (200 fatal cases) was reported in Anco.
2003 – 31 fatal cases were reported. 3,431 cases were reported in Ancash and 1,220 in La Libertad.
2004 – 4,087 cases were reported in Jaen and 3,979 in Ancash.
2007 – 1,857 cases (12 fatal) of acute infection 584 of chronic infection were reported.
2011 – A fatal case was reported in the Lambayeque region.
1987 – An outbreak (554 cases, 14 fatal) was reported in Shumpillan Village (Pomabamba Province).
1998 – Outbreaks were reported in new focus in the Urubama region (20 cases), and in Cuzco Department.
2006 – An outbreak (10 cases) was reported in a new focus in Arahuan District, Lima Province.

Vectors:
– The local sand-fly vector is Lutzomyia verrucarum.
– L. maranonensis and L. rubusta have also been implicated.

Reference:
1. Berger SA. Infectious Diseases of Peru, 2011. 401 pp, 92 graphs, 1,282 references. Gideon e-books, https://www.gideononline.com/ebooks/country/infectious-diseases-of-peru/

Outbreaks of Toxoplasmosis

Despite a widespread prevalence of toxoplasmosis among humans and other vertebrates, overt outbreaks are rarely reported. The following chronology is abstracted from Gideon (www.GideonOnline.com) and the Gideon e-book series. [1] (Primary references available on request)

Outbreaks among humans:
1967 (publication year) – Brazil. An outbreak at a Paulist seminary in Braganza, Sao Paulo State.
1969 (publication year) – Brazil. An outbreak of toxoplasmosis at a university in Sao-Jose-dos Campos, Sao Paulo.
1977 – United States. An outbreak (37 cases) in Georgia among patrons of a riding stable.
1978 – United States. An outbreak (10 cases) among members of a family in California, associated with consumption of raw goat’s milk.
1979 – Italy. An outbreak (5 cases) among members of a family.
1980 (publication year) – United States. An outbreak (10 cases) in an extended family, related to cat contact.
1981 (publication year) – United States. An outbreak in Georgia.
1982 (publication year) – Brazil. An outbreak in a rural area.
1984 (publication year) – United States. An outbreak (9 cases) among family members on an Illinois farm.
1984 (publication year) – Australia. An outbreak (5 cases) among members of a Lebanese family in Australia was ascribed to contaminated Kibbi (a traditional meat dish)
1990 (publication year) – Canada. 4 cases among pregnant women in Quebec, associated with consumption of raw meat.
1993 – Brazil. An outbreak (20 cases) in Parana was ascribed to ingestion of contaminated mutton.
1995 – Canada. An outbreak (2,895 to 7,118) cases in the Greater Victoria area of British Columbia. This was the largest recorded outbreak of toxoplasmosis from water
1997 (publication year) – Republic of Korea. Two outbreaks (8 cases) associated with consumption of uncooked pork.
2001 – Brazil. A water-borne outbreak (176 cases) in Parana
2002 – Brazil. A water-borne outbreak (426 cases) in Parana
2002 – Turkey. An outbreak (171 cases) at a boarding school in Izmir.
2003 to 2004 – French Guiana. An outbreak (11 cases, 3 fatal) in Patam, among immunocompetent patients.
2010 (publication year) – India. An outbreak (248 cases) of Toxoplasma retinitis in Tamil Nadu was ascribed to ingestion of contaminated water

Veterinary outbreaks:
1953 (publication year) – Norway. An outbreak among chickens
1964 (publication year) – Canada. An outbreak (44 cases) chinchillas (Chinchilla lanigera) in Ontario.
1977 (publication year) – Sweden. An outbreak of among pigs.
1977 – United States. An outbreak (4 cases) among wallaroos (Macropus robustus) in a California zoo.
1986 (publication year) – United States. An outbreak among captive kangaroos, wallabies, and potaroos.
1986 (publication year) – Italy. An outbreak on an bird-farm in Vicenza involved small passerine birds (Serinus canaria, Carduelis chloris, Carduelis carduelis, Carduelis spinus, Carduelis cannabina and Pyrrhula pyrrhula).
1992 (publication year) – United States. An outbreak among wallabies on an exotic animal farm.
1992 (publication year) – United Kingdom. An outbreak of toxoplasmosis among captive squirrel monkeys (Saimiri sciureus)
1996 – Czezh Republic. An outbreak among Angora goats.
1999 – United States. An outbreak among Wisconsin mink (Mustela vison).
2004 – China. An outbreak among swine in Ganzu Province.
2008 (publication year) – Israel. An outbreak (19 cases) among captive squirrel monkeys (Saimiri sciureus) was ascribed to contaminated feed.
2008 (publication year) – South Africa. An outbreak (8 cases) among Nicobar pigeons (Caloenas nicobaria) in an aviary collection.
2009 (publication year) – Italy. An outbreak among ovines on a farm.
2009 (publication year) – Republic of Korea. An outbreak of porcine abortion due to toxoplasmosis was reported in Jeju Island.

Reference:
1. Berger SA. Toxoplasmosis: Global Status, 2011. 92 pp, 74 graphs, 950 references. Gideon e-books, https://www.gideononline.com/ebooks/disease/toxoplasmosis-global-status/

Botulism in the United States

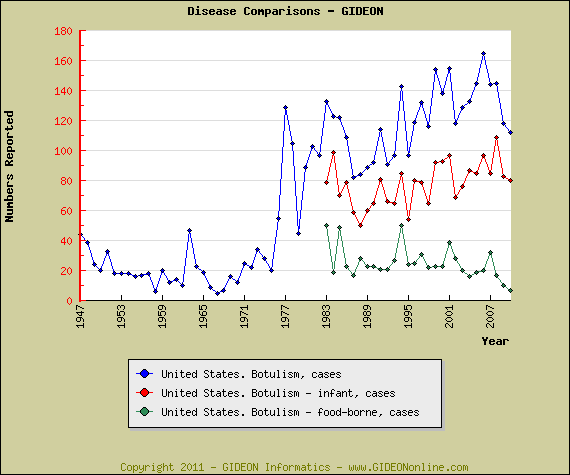
Notwithstanding a recent outbreak in Utah, infant botulism has accounted for an growing percentage of total cases in recent years. [1,2] In the following graph, I’ve summarized trends for botulism in the United States. Note that total case numbers have been increasing since 1995, despite a decrease in the incidence of food-borne botulism.

(See the Graph tool tutorial at www.GIDEONonline.com/wp/wp-content/uploads/Gideon-Graphs.pps )

References:
1. Berger SA. Infectious Diseases of the United States, 2011. 1030 pp, 464 graphs, 8237 references. Gideon e-books, www.gideononline.com/ebooks/country/infectious-diseases-of-the-united-states/
2. Berger SA. Botulism: Global Status, 2011. 80 pages, 86 graphs, 510 references. Gideon e-books, www.gideononline.com/ebooks/disease/botulism-global-status/

Intestinal Protozoa in the United States

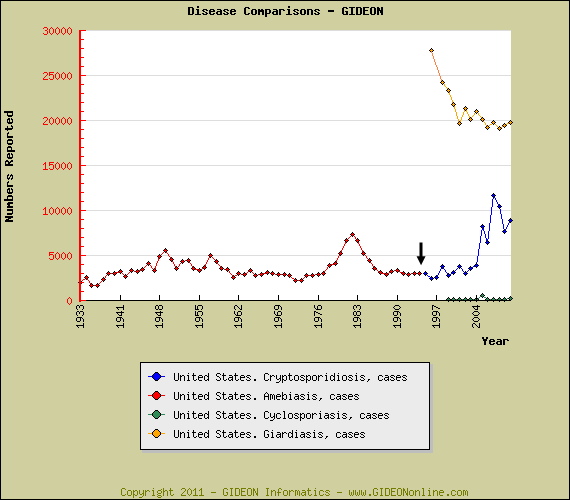
Notwithstanding a recent outbreak in Georgia, Cyclospora is the least common intestinal protozoan reported in the United States. [1] In the following chart, I have summarized the incidence of cyclosporiasis, giardiasis, amebiasis and cryptosporidiosis. As indicated at the black arrow, ongoing trends for amebiasis (no longer reported as of 1994 = 2,983 cases) were “continued” by reports of cryptosporidiosis (2,972 cases in 1995).

(outline of Gideon Graph module – see https://www.gideononline.com/wp-content/uploads/Gideon-Graphs.pps)

Reference:
1. Berger SA. Infectious Diseases of the United States, 2011. 1030 pp, 464 graphs, 8237 references. Gideon e-books, www.gideononline.com/ebooks/country/infectious-diseases-of-the-united-states/

Note published in ProMED

Tick-Borne Encephalitis in Sweden

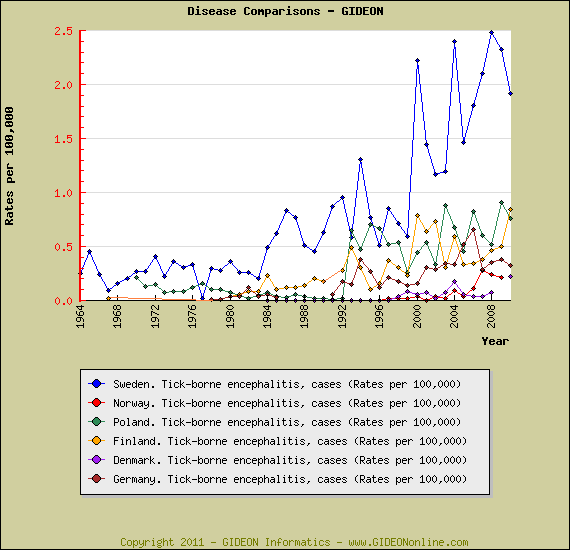
Rates of tick-borne encephalitis in Sweden are now well beyond those of surrounding countries, and have been increasing significantly since 2000. [1,2] See graph

(outline of Gideon Graph module – see https://www.gideononline.com/wp-content/uploads/Gideon-Graphs.pps )

References:
1. Berger SA. Infectious Diseases of Sweden, 2011. 427 pp, 133 graphs, 1346 references. Gideon E-books, https://www.gideononline.com/ebooks/country/infectious-diseases-of-sweden/2. Berger SA. Tick-borne Encephalitis: Global Status, 2011. 54 pp, 44 graphs, 314 references. Gideon E-books, https://www.gideononline.com/ebooks/disease/tick-borne-encephalitis-global-status/

Note discussed in ProMED

Deaths Due to Food-borne Listeria

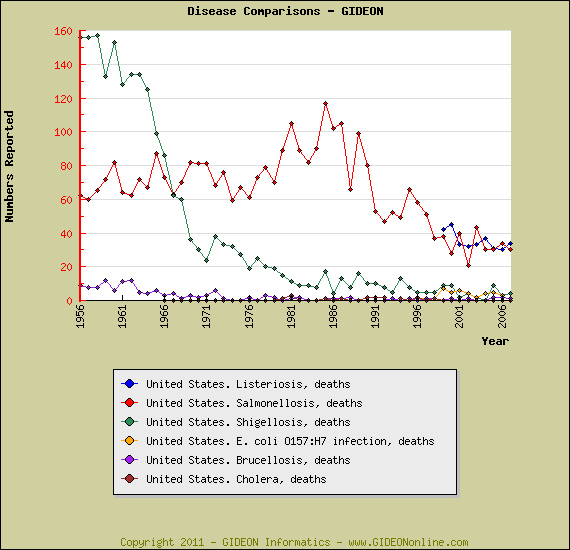
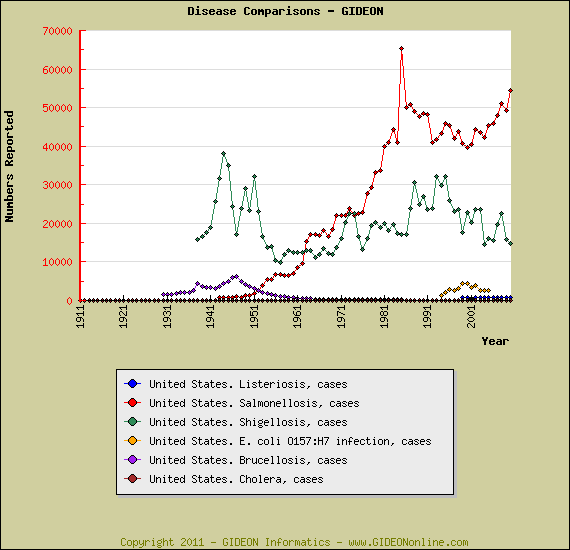
Although Listeria monocytogenes is a relatively uncommon cause of food-borne infection in the United States, this species is associated with a disproportionate mortality rate. In recent years, Salmonella and Listeria have been associated with more cases of fatal bacterial food related disease than any other agent, despite the the relative rarity of listeriosis as a disease. [1,2] In fact, case-fatality rates of the most common agent, Salmonella, have not paralleled increases in disease incidence. See graphs 1 and 2.

(See the Graph tool tutorial at https://www.gideononline.com/wp-content/uploads/Gideon-Graphs.pps )

References:
1. Berger SA. Infectious Diseases of the United States, 2011. 1030 pp, 464 graphs, 8237 references. Gideon e-books, https://www.gideononline.com/ebooks/country/infectious-diseases-of-the-united-states
2. Berger SA. Listeriosis: Global Status, 2011. 93 pp, 103 graphs, 487 references. Gideon e-books, https://www.gideononline.com/ebooks/disease/listeriosis-global-status/

Note disussed in Promed

Endemic Typhus in the United States

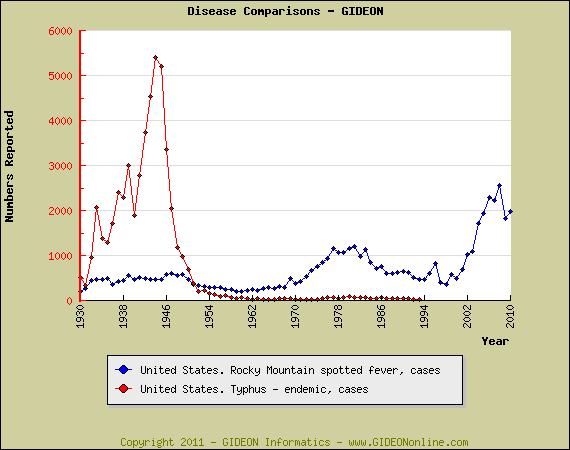
Although national reporting was discontinued as of 1994, endemic typhus was once the most common rickettsial infection in the United States. [1,2] (see graph).

19,663 cases of endemic typhus were reported during 1944 to 1953; 812 during 1954 to 1963; 315 during 1964 to 1973; 588 during 1974 to 1983; and only 447 during 1984 to 1993. Disease rates peaked during the 1930’s and 1940’s. In fact, 787 military personnel acquiring the disease 15 fatal) during World War II – 497 of these infected in the United States. [1,2]

(See the Graph tool tutorial at https://www.gideononline.com/wp-content/uploads/Gideon-Graphs.pps )

References:
1. Berger SA. Infectious Diseases of the United States, 2011. 1030 pp, 464 graphs, 8237 references. Gideon e-books, https://www.gideononline.com/ebooks/country/infectious-diseases-of-the-united-states/
2. Berger SA. Endemic Typhus Group: Global Status, 2011. 50 pp, 34 graphs, 185 references. Gideon e-books, https://www.gideononline.com/ebooks/disease/endemic-typhus-group-global-status/

Reported in ProMED

Legionellosis in Italy

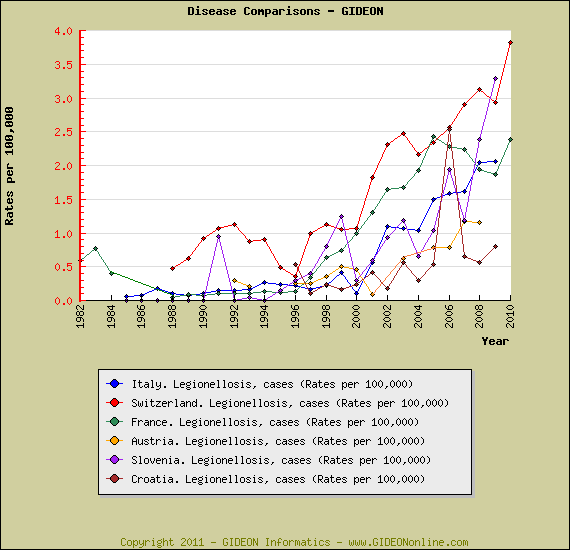
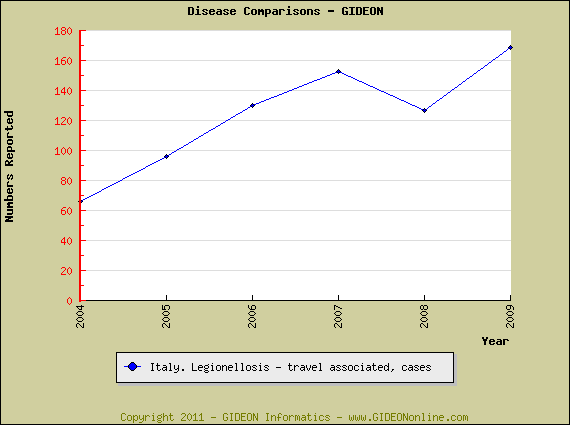
Rates of legionellosis in Italy and surrounding countries have increased dramatically since 2000, while the number of travel-associated cases in Italy has almost tripled during this period. [1,2] See graphs:

A tutorial for the Gideon graph tool is available at https://www.gideononline.com/wp-content/uploads/Gideon-Graphs.pps

References:
1. Berger SA. Infectious Diseases of Italy, 2011. 472 pp, 111 graphs, 2235 references. Gideon e-books, https://www.gideononline.com/ebooks/country/infectious-diseases-of-italy/
2. Berger SA. Legionellosis: Global Status, 2011. 90 pp, 106 graphs, 755 references. Gideon e-books, https://www.gideononline.com/ebooks/disease/legionellosis-global-status/

This post has been discussed on ProMED

GIDEON Sign In