GIDEON blog

Free Demo ► Latest Updates ► Video Tutorials ►
Subscribe , j x

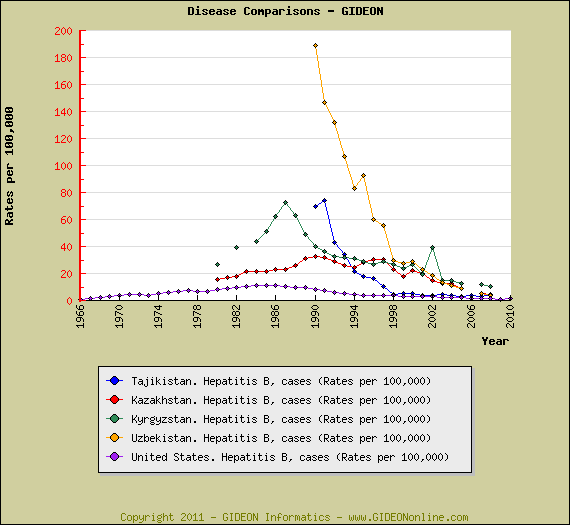
Hepatitis B in Tajikistan

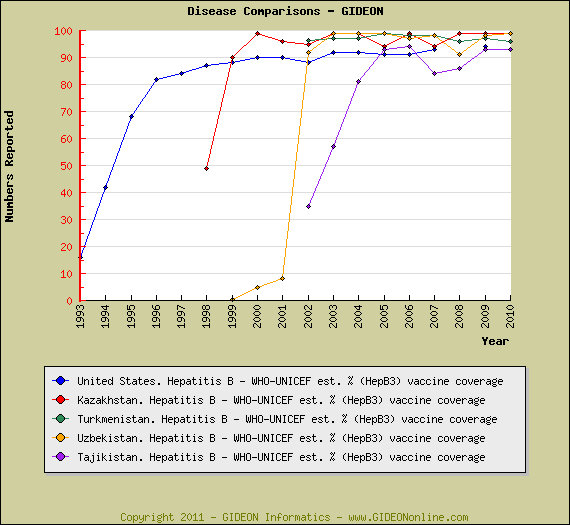
Rates of hepatitis B in Tajikistan and surrounding countries have declined considerably since the 1990’s, and are similar to those reported in the United States. Interestingly, this trend began a decade before the introduction of universal Hepatitis B vaccination in the region. [1,2]

References:
1. Berger SA. Infectious Diseases of Tajikistan, 2011. 340 pp, 80 graphs, 87 references. Gideon e-books, https://www.gideononline.com/ebooks/country/infectious-diseases-of-tajikistan/2. Berger SA. Hepatitis B: Global Status, 2011. 327 pp, 405 graphs, 1517 references. Gideon e-books, https://www.gideononline.com/ebooks/disease/hepatitis-b-global-status/

Cited in ProMED
c
Featured in ProMED

Imported Rabies: 1970 to 2011

An ongoing chronology of cross-border rabies cases reported during 1970 to July 2011 includes 59 cases of human infection, from 20 countries; and 29 importations of rabid animals (27 dogs, 1 horse and 1 cat) from 14 countries. Gideon www.GideonOnline.com The most common countries for human exposure were India and the Philippines (8 cases each), followed by Mexico (6) and Morocco (4). Seven rabid animals originated in Morocco. The case detailed in ProMED is the third to originate in Haiti (the two previous patients also died in the United States), and the thirteenth case of imported rabies in the U.S. since 1983. [1,2]

References:
1. Berger SA. Rabies: Global Status, 2011. 366 pp, 546 graphs, 1056 references. Gideon e-book series, https://www.gideononline.com/ebooks/disease/rabies-global-status/2. Berger SA. Infectious Diseases of the United States, 2011. 1030 pages, 464 graphs, 8237 references, https://www.gideononline.com/ebooks/country/infectious-diseases-of-the-united-states/

Diphtheria in India

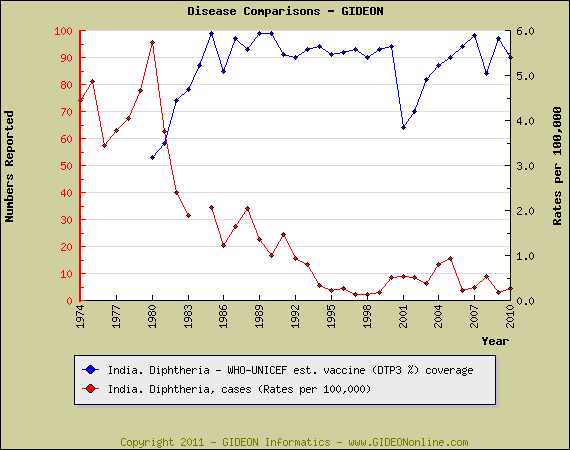
Diphtheria rates in India have decreased considerably since 1980, in parallel with increasing vaccination coverage. [1,2]

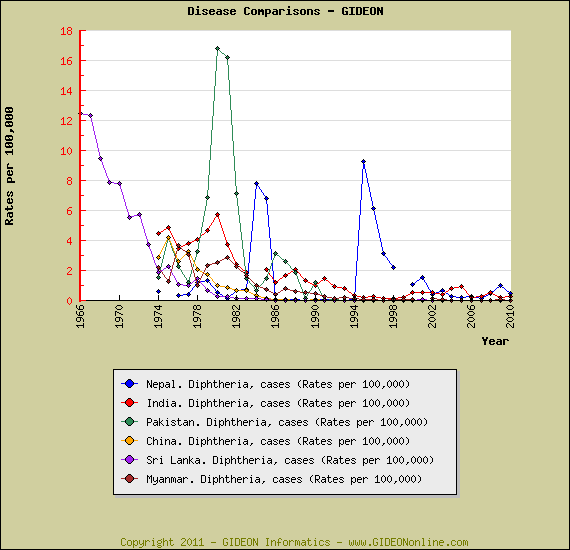
During the past decade rates in India have been similar to those of surrounding countries.

References:
1. Berger SA. Infectious Diseases of India, 2011. 480 pp, 65 graphs, 3503 references. Gideon e-books, https://www.gideononline.com/ebooks/country/infectious-diseases-of-india/
2. Berger SA. Diphtheria: Global Status, 2011. 303 pp, 441 graphs, 259 references. Gideon e-books, https://www.gideononline.com/ebooks/disease/diphtheria-global-status/

Tick-borne Encephalitis (correction)

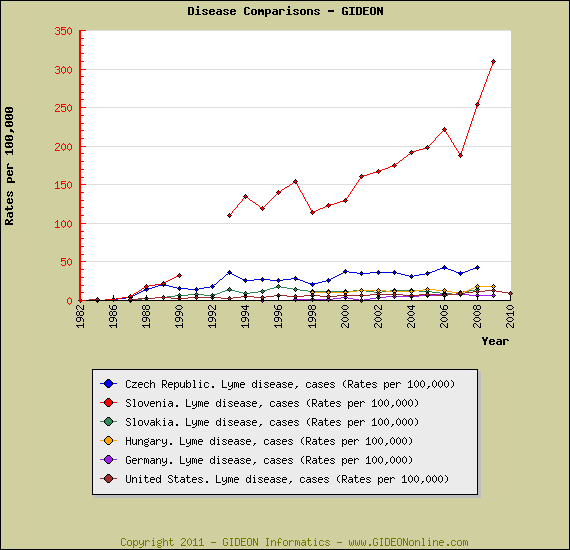
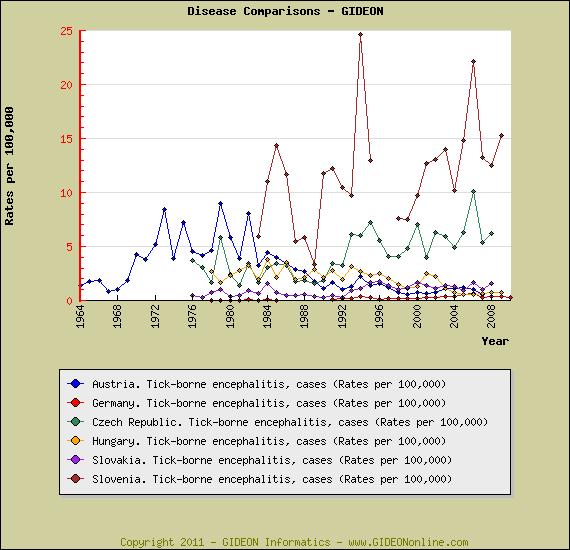
In a previous post, I noted that “highest rates [of Tick-borne encephalitis] are reported in Germany and the Czech Republic.” The statement should read, “highest rates …. in Slovenia and the Czech Republic.” Not surprisingly, Slovenia and the Czech Republic also report the highest rates of Lyme borreliosis, another tick-borne illness. In the following graph, rates for the United States are added for comparison. [1,2]

References:
1. Berger SA. Infectious Diseases of Slovenia, 2011. 377 pp., 114 graphs, 931 references. Gideon e-books, https://www.gideononline.com/ebooks/country/infectious-diseases-of-slovenia/
2. Berger SA. Lyme disease: Global Status, 2011. 68 pp., 61 graphs, 496 references. Gideon e-books, https://www.gideononline.com/ebooks/disease/lyme-disease-global-status/

Tick-borne Encephalitis in Austria

Prior to the institution of mass vaccination in 1981, Austria reported the highest rates of Tick-borne encephalitis in Western Europe. Currently, highest rates are reported in Germany and the Czech Republic. [1,2] see graph –

References:
1. Berger SA. Infectious Diseases of Austria, 2011. 399 pp, 108 graphs, 1187 references. Gideon e-books, https://www.gideononline.com/ebooks/country/infectious-diseases-of-austria/
2. Berger SA. Tick-borne Encephalitis: Global Status, 2011. 54 pp, 44 graphs, 314 references. Gideon e-books, https://www.gideononline.com/ebooks/disease/tick-borne-encephalitis-global-status/

Update:
Reported on ProMED

Leptospirosis in France

France reports the highest rate of leptospirosis in Europe. In the following graph, I have compared reported rates per 100,000 in France with those of contiguous countries. [1,2]
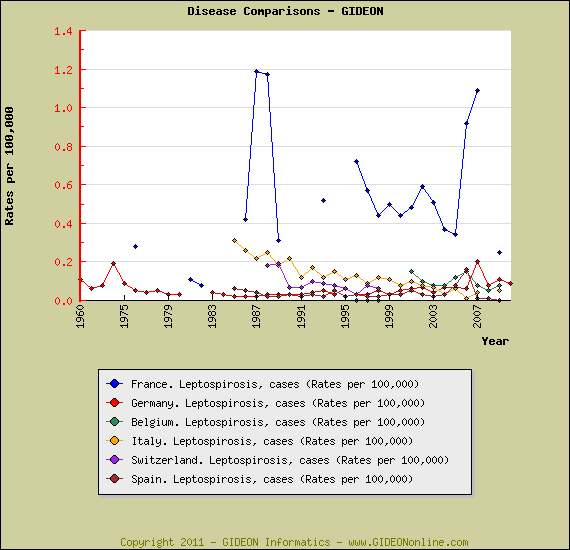
Most cases occur in the river basins of the southwest coast, notably Franche-Comte, Champagne-Ardennes and Poitou-Charentes. During 1996 to 2005, disease rates in Ardennes varied from 1.7 to 7.9 per 100,000 – approximately 10-fold the national rate.

48% of cases are reported during July through September.

The principal reservoirs in this country are rats, pigs, cattle, mice, buffalo, horses and coypu (Myocastor coypus).

Prevalence surveys:
29.7% of cattle, 51% of pigs, 78.6% of horses, 10% to 20% of wild rodents (1997)
44% of rodents (2008 publication)
Leptospira accounts for 1.3% of bacterial species causing uveitis (2001 to 2007)
23% of European mink (Mustela lutreola, 22% of polecats (Mustela putorius), and 15% of free-ranging American mink (Mustela vison) in southwestern France (1990 to 2007)

Infecting species:
– The principal species are Leptospira serovars icterohaemorrhagiae (30% of cases), australis, grippotyphosa (23% of cases), sejroe, Ballum, hebdomadis, canicola, bataviae and pomona.
– Rare instances of infection by Leptospira broomii have been reported.

References:
1. Berger SA. Infectious Diseases of France, 2011. 687 pp, 286 graphs, 2159 references. Gideon e-books, https://www.gideononline.com/ebooks/country/infectious-diseases-of-france/
2. Berger SA. Leptospirosis: Global Status, 2011. 148 pp, 165 graphs, 834 references. Gideon e-books, https://www.gideononline.com/ebooks/disease/leptospirosis-global-status/

Update:
Reported on ProMED
Reye’s Syndrome in Hong Kong

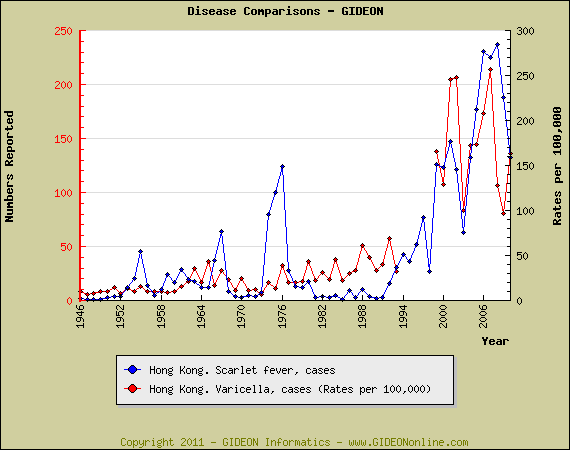
A single review of Reye’s syndrome in Hong Kong has been published. [1,2] 27 cases were treated at Queen Mary Hospital during 1979 to 1985 – a period of low activity for both Varicella and Scarlet Fever – see graph] Where a drug history was available, only 15% had received aspirin prior to the onset of illness, while 60% had received paracetamol. Influenza was presumed to be the underlying infection in most cases, rather than varicella.

1. Yu EC. Reye’s syndrome in Hong Kong. Aust Paediatr J. 1988 24:61.
2 Berger SA. Infectious Diseases of Hong Kong, 2011. 375 pp, 107 graphs, 1229 references. Gideon e-books, https://www.gideononline.com/ebooks/country/infectious-diseases-of-hong-kong/

Update: Posted in ProMED

Scarlet Fever and Varicella in Hong Kong

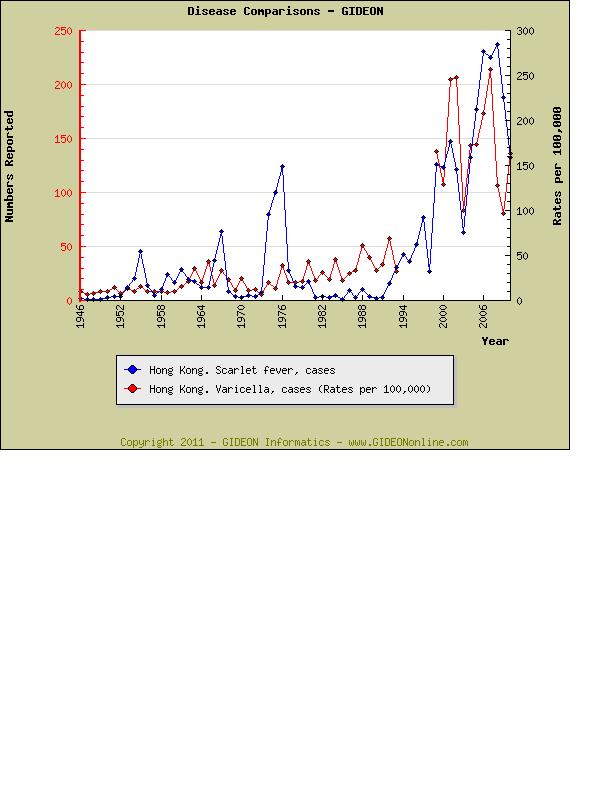
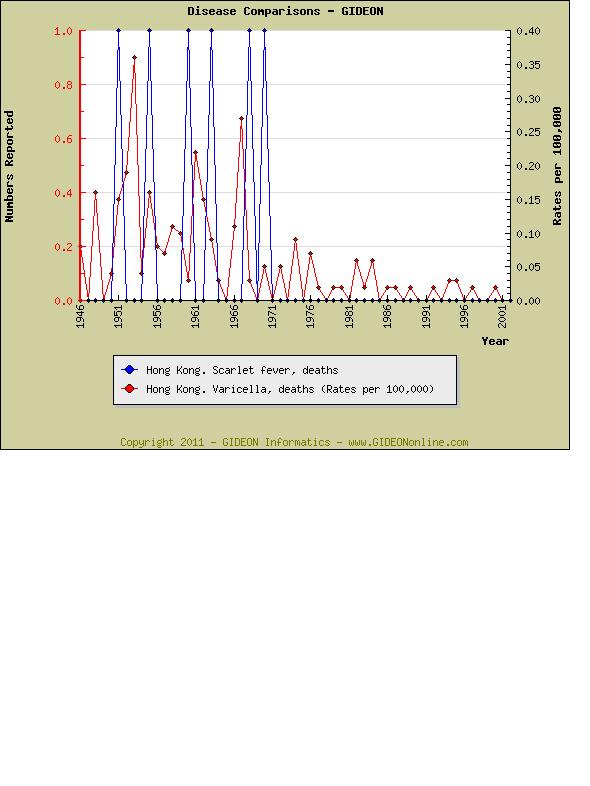
There is a striking similarity between reported incidence of varicella and scarlet fever in Hong Kong. [1,2] In order to present data to scale on the following graphs, I have compared numerical incidence and death statistics for scarlet fever against comparable rates per 100,000 for varicella.

References:
1. Berger SA. Infectious Diseases of Hong Kong, 2011. 375 pp, 107 graphs, 1229 references. Gideon e-books, https://www.gideononline.com/ebooks/country/infectious-diseases-of-hong-kong/

Update: Posted in ProMED
2. Berger SA. Varicella-Zoster: Global Status, 2011. 106 pp, 122 graphs, 328 references. Gideon e-books, https://www.gideononline.com/ebooks/disease/varicella-zoster-global-status/

Scarlet Fever in Hong Kong

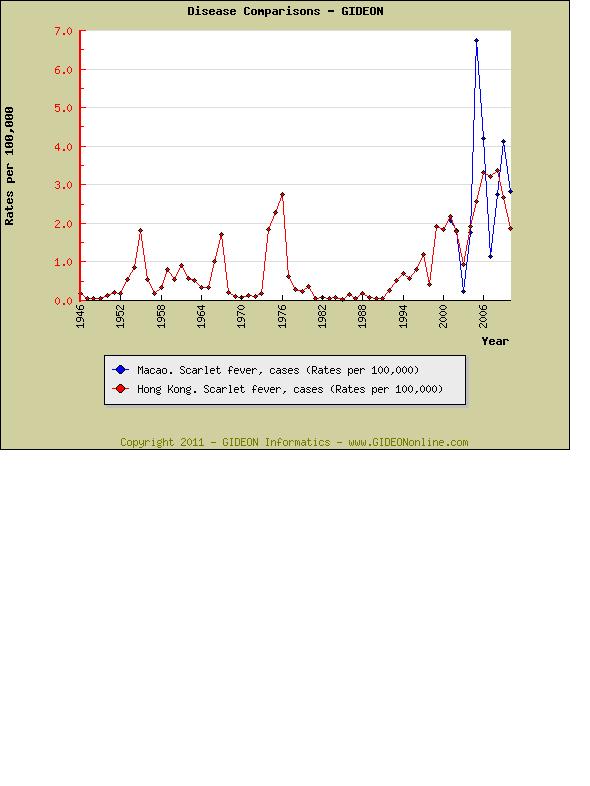
Rates of scarlet fever in Hong Kong declined considerably since the 1970’s, but have been increasing during the past decade. Only six fatal cases were recorded during 1946 to 2006 – the last in 1970. As seen in the following graph, scarlet fever rates in Macau have paralleled those of Hong Kong. [1-3]

References:
1. Berger SA. Infectious Diseases of Hong Kong, 2011. 375 pp, 107 graphs, 1229 references. Gideon e-books, https://www.gideononline.com/ebooks/country/infectious-diseases-of-hong-kong/
2. Berger SA. Infectious Diseases of Macao, 2011. 311 pp, 60 graphs, 833 references. Gideon e-books, https://www.gideononline.com/ebooks/country/infectious-diseases-of-macao/
3. Berger. SA. Rheumatic Fever and Scarlet Fever: Global Status, 2011. 96 pp, 130 graphs, 90 references. Gideon e-books, https://www.gideononline.com/ebooks/disease/rheumatic-fever-and-scarlet-fever-global-status/

Chlamydia Infection in Denmark

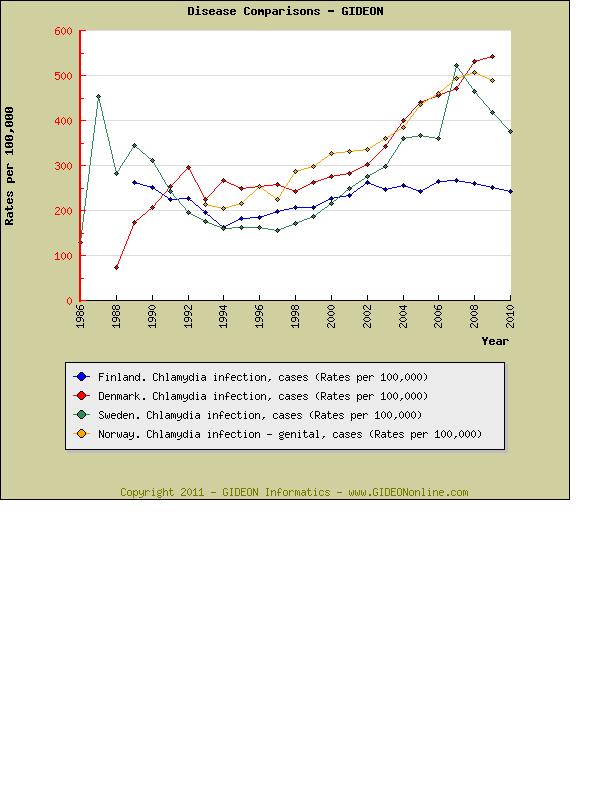
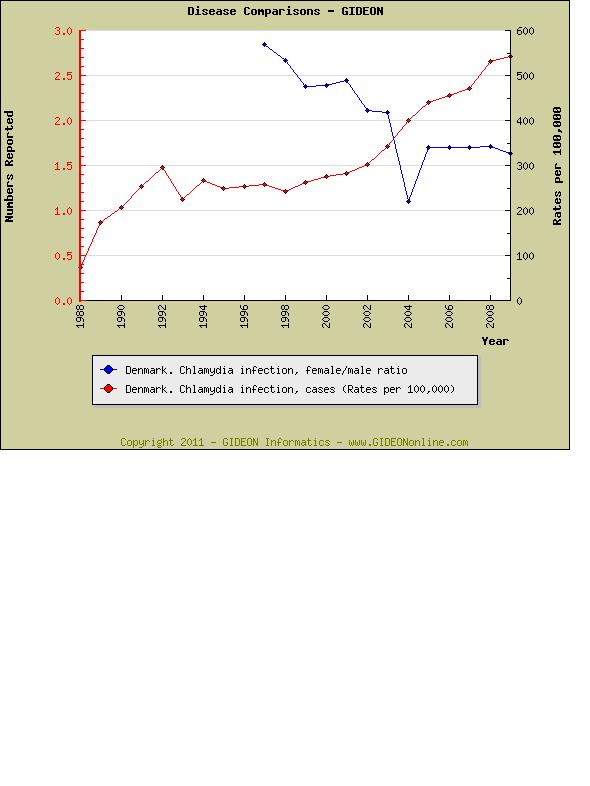
Urogenital chlamydia infection was integrated into the Danish national reporting scheme in 1994. Increasing disease rates have also been encountered in Sweden and Norway, and have been characterized by a growing percentage of male patients. [1,2]


Prevalence surveys:
5.0% of men seen in general practice (2005 publication)
1.3% of women above age 30 in Arhus county (2003 publication)
15.7% of women seeking abortion in Aarhus (2008 publication)

Seroprevalence surveys:
23% of women with tubal factor infertility, and 36% with a self-reported history of PID attending fertility clinics (Arhus, 2007 publication)

1. Berger SA. Infectious Diseases of Denmark, 2011. Gideon e-book series, 445 pp, 176 graphs, 1251 references, https://www.gideononline.com/ebooks/country/infectious-diseases-of-denmark/
2. Berger SA. Miscellaneous Chlamydia: Global Status, 2011. Gideon e-book series, 114 pages, 121 graphs, 835 references https://www.gideononline.com/ebooks/disease/miscellaneous-chlamydia-global-status/

Featured on ProMED

GIDEON Sign In